

Why Back-to-Back Games Are a Sharp Bettor’s Favourite Angle
Four seasons ago, I started flagging every NHL back-to-back on my calendar and tracking the results against the closing line. What I found confirmed what sharper bettors had been saying for years: the market adjusts for fatigue, but it doesn’t always adjust enough. The team playing the second game of a back-to-back wins less often than the closing line implies, and that gap — small but persistent — creates one of the most reliable situational edges in hockey betting.
NHL viewership averaged 546,000 per game in the 2025-26 season, the highest in 14 years. That audience growth has increased betting volume and sharpened lines overall. But back-to-back situations remain slightly underpriced because the factors that drive them — roster decisions, travel, cumulative physical toll — are harder to model than team quality or recent form. The market knows a back-to-back team is at a disadvantage. The question is whether the price reflects the full extent of that disadvantage.
Every NHL team plays roughly 12-15 back-to-back sets per season. That’s 24-30 individual games where schedule fatigue is a meaningful variable. For a bettor who tracks these situations systematically, that’s more than enough sample to build a dedicated approach.
How Fatigue Shows Up in NHL Performance Data
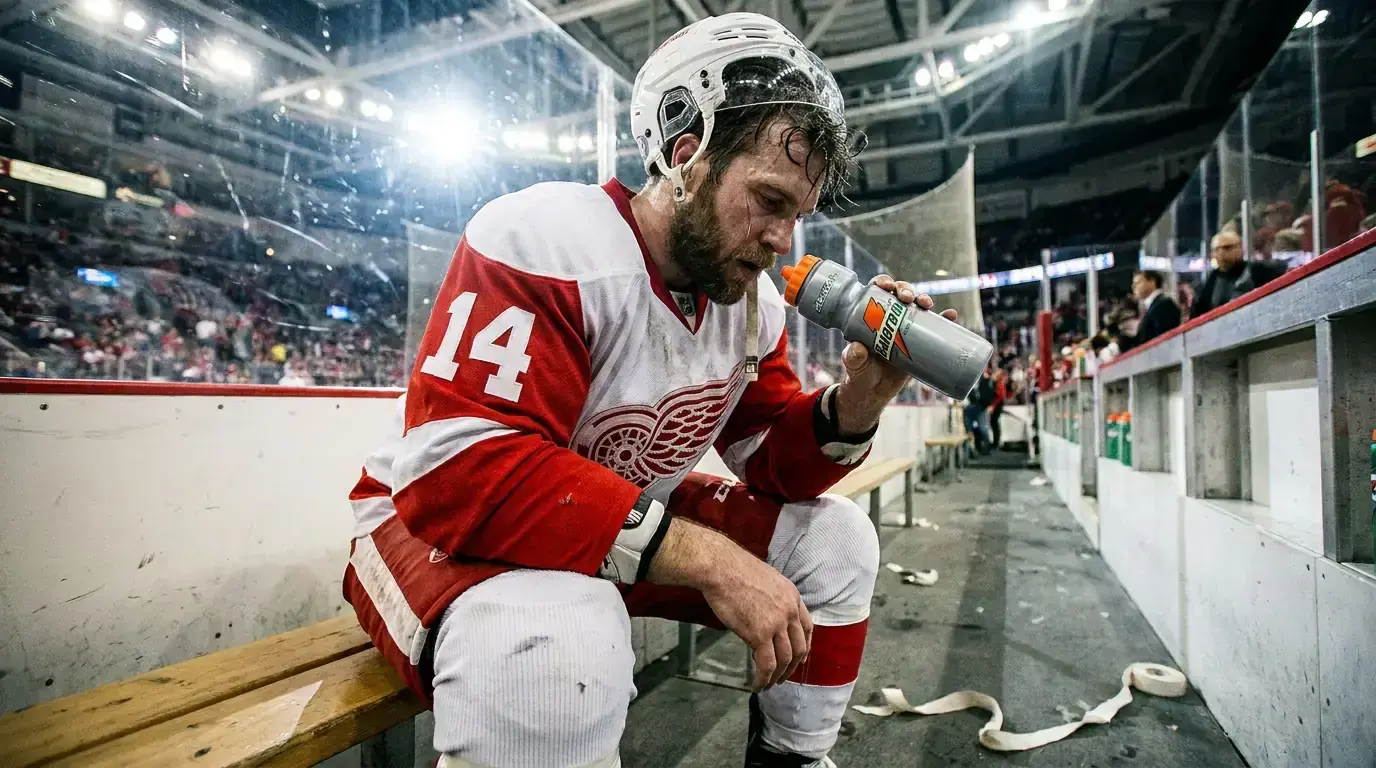
Fatigue in hockey isn’t subtle. It shows up in three measurable ways: defensive lapses, reduced skating speed, and goaltending performance.
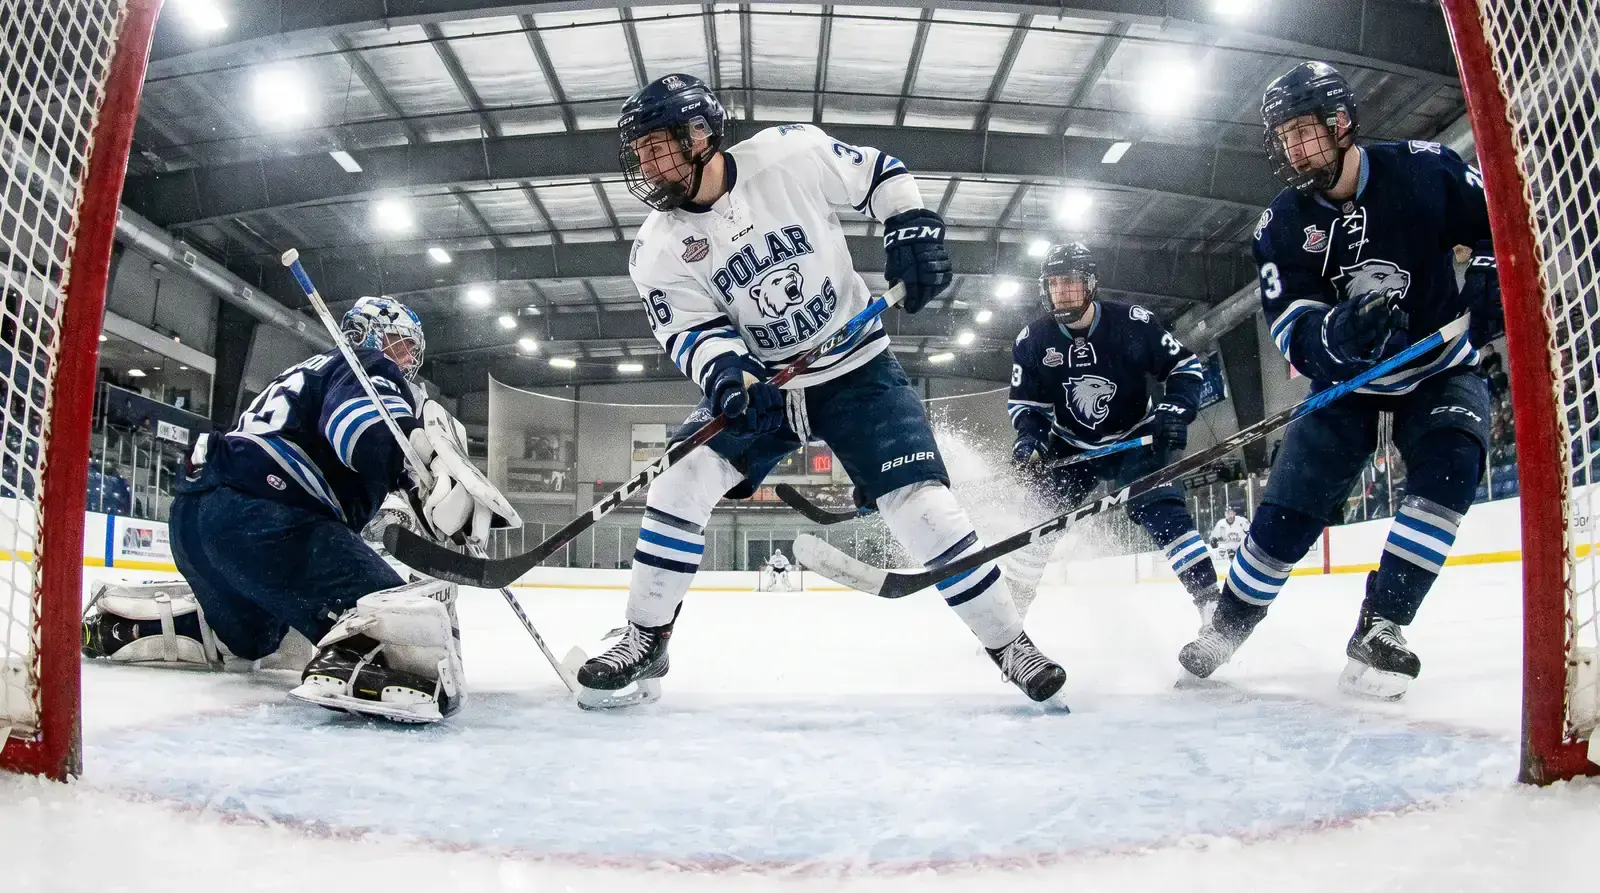
Defensive breakdowns increase in the second half of back-to-backs because tired legs make it harder to backcheck and maintain gap control in the neutral zone. Teams on the second night of a back-to-back allow more odd-man rushes, more shots from high-danger areas, and more second-chance opportunities off rebounds. These aren’t abstract observations — they show up in the shot quality data (xG against) as a measurable increase of 0.2-0.4 expected goals against per game relative to the team’s season average.
Skating speed declines by the third period of back-to-back second games. The NHL’s player tracking data, available since the 2019-20 season, shows that average skating speed drops by roughly 2-3% in the final frame of back-to-back games. That might sound trivial, but in a sport decided by fractions of seconds — the difference between reaching a loose puck and not, between closing a shooting lane and leaving it open — a 2-3% speed reduction has tangible consequences.

The cumulative effect is a win rate reduction. Teams on the second night of a back-to-back win approximately 44-46% of their games, compared to a baseline win rate that typically sits around 50%. The drop is more pronounced on the road — road teams playing the second of a back-to-back win closer to 40-42%. These numbers fluctuate by season and team quality, but the direction is consistent.
Goaltender Rotation on Back-to-Backs
A goaltender change on a back-to-back is worth 3-5% of implied probability, and back-to-back situations are the most common trigger for such changes. Most NHL coaches use a predictable rotation: the starting goaltender plays one game and the backup plays the other. Which goaltender gets which game depends on the opponent, the travel, and the coach’s assessment of where each game falls in terms of importance.
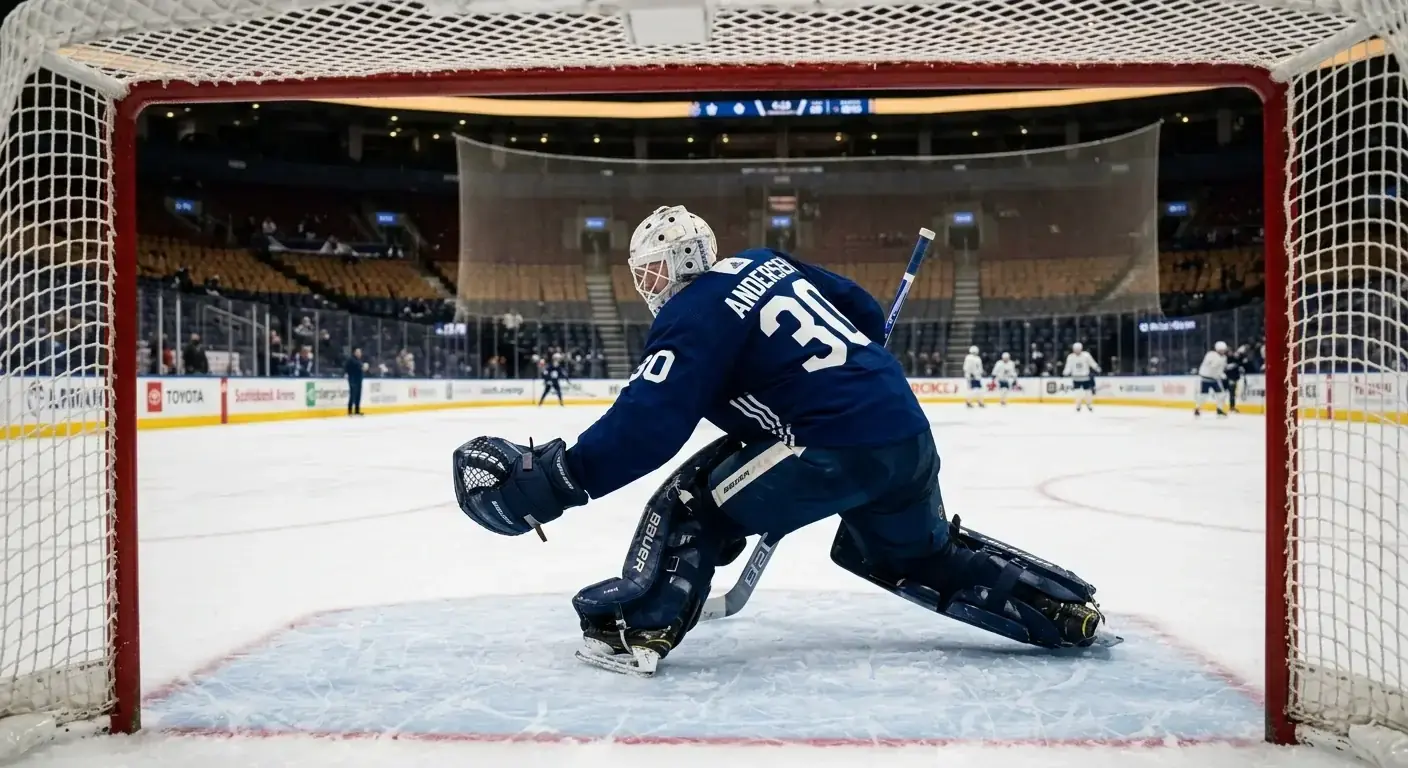
The market has partially adapted to this pattern. When a team’s backup goaltender is widely expected to start the second game of a back-to-back, the line typically adjusts before the official confirmation. But “partially adapted” isn’t the same as “fully priced in.” I’ve found that the pre-confirmation line often undersells the impact of the backup start — the adjustment is 2-3% when the actual impact is closer to 4-5% for teams with a significant quality gap between their two goaltenders.
The betting opportunity is clearest when a team has a wide goaltender quality gap and faces a rested opponent. If the backup is a young, unproven netminder starting on the road against a home team that had a day off, the combination of goaltending downgrade and travel fatigue creates a situation where the closing line is likely to favour the rested side even more than the opening line does. Getting your bet down early — before the morning skate confirmation pushes the line further — captures the best price.
Conversely, teams with two reliable goaltenders — a legitimate 1A/1B tandem — show almost no performance drop on back-to-backs. The goaltender rotation doesn’t hurt them because both options are starting-calibre. Identifying which teams run genuine tandems versus which teams have a clear starter and a weaker backup is a pre-season research task that pays dividends all year.
A Step-by-Step Approach to Back-to-Back Betting
Step one: identify the back-to-back set on the NHL schedule at the start of each week. I pull the upcoming week’s slate every Monday and flag all back-to-back situations.
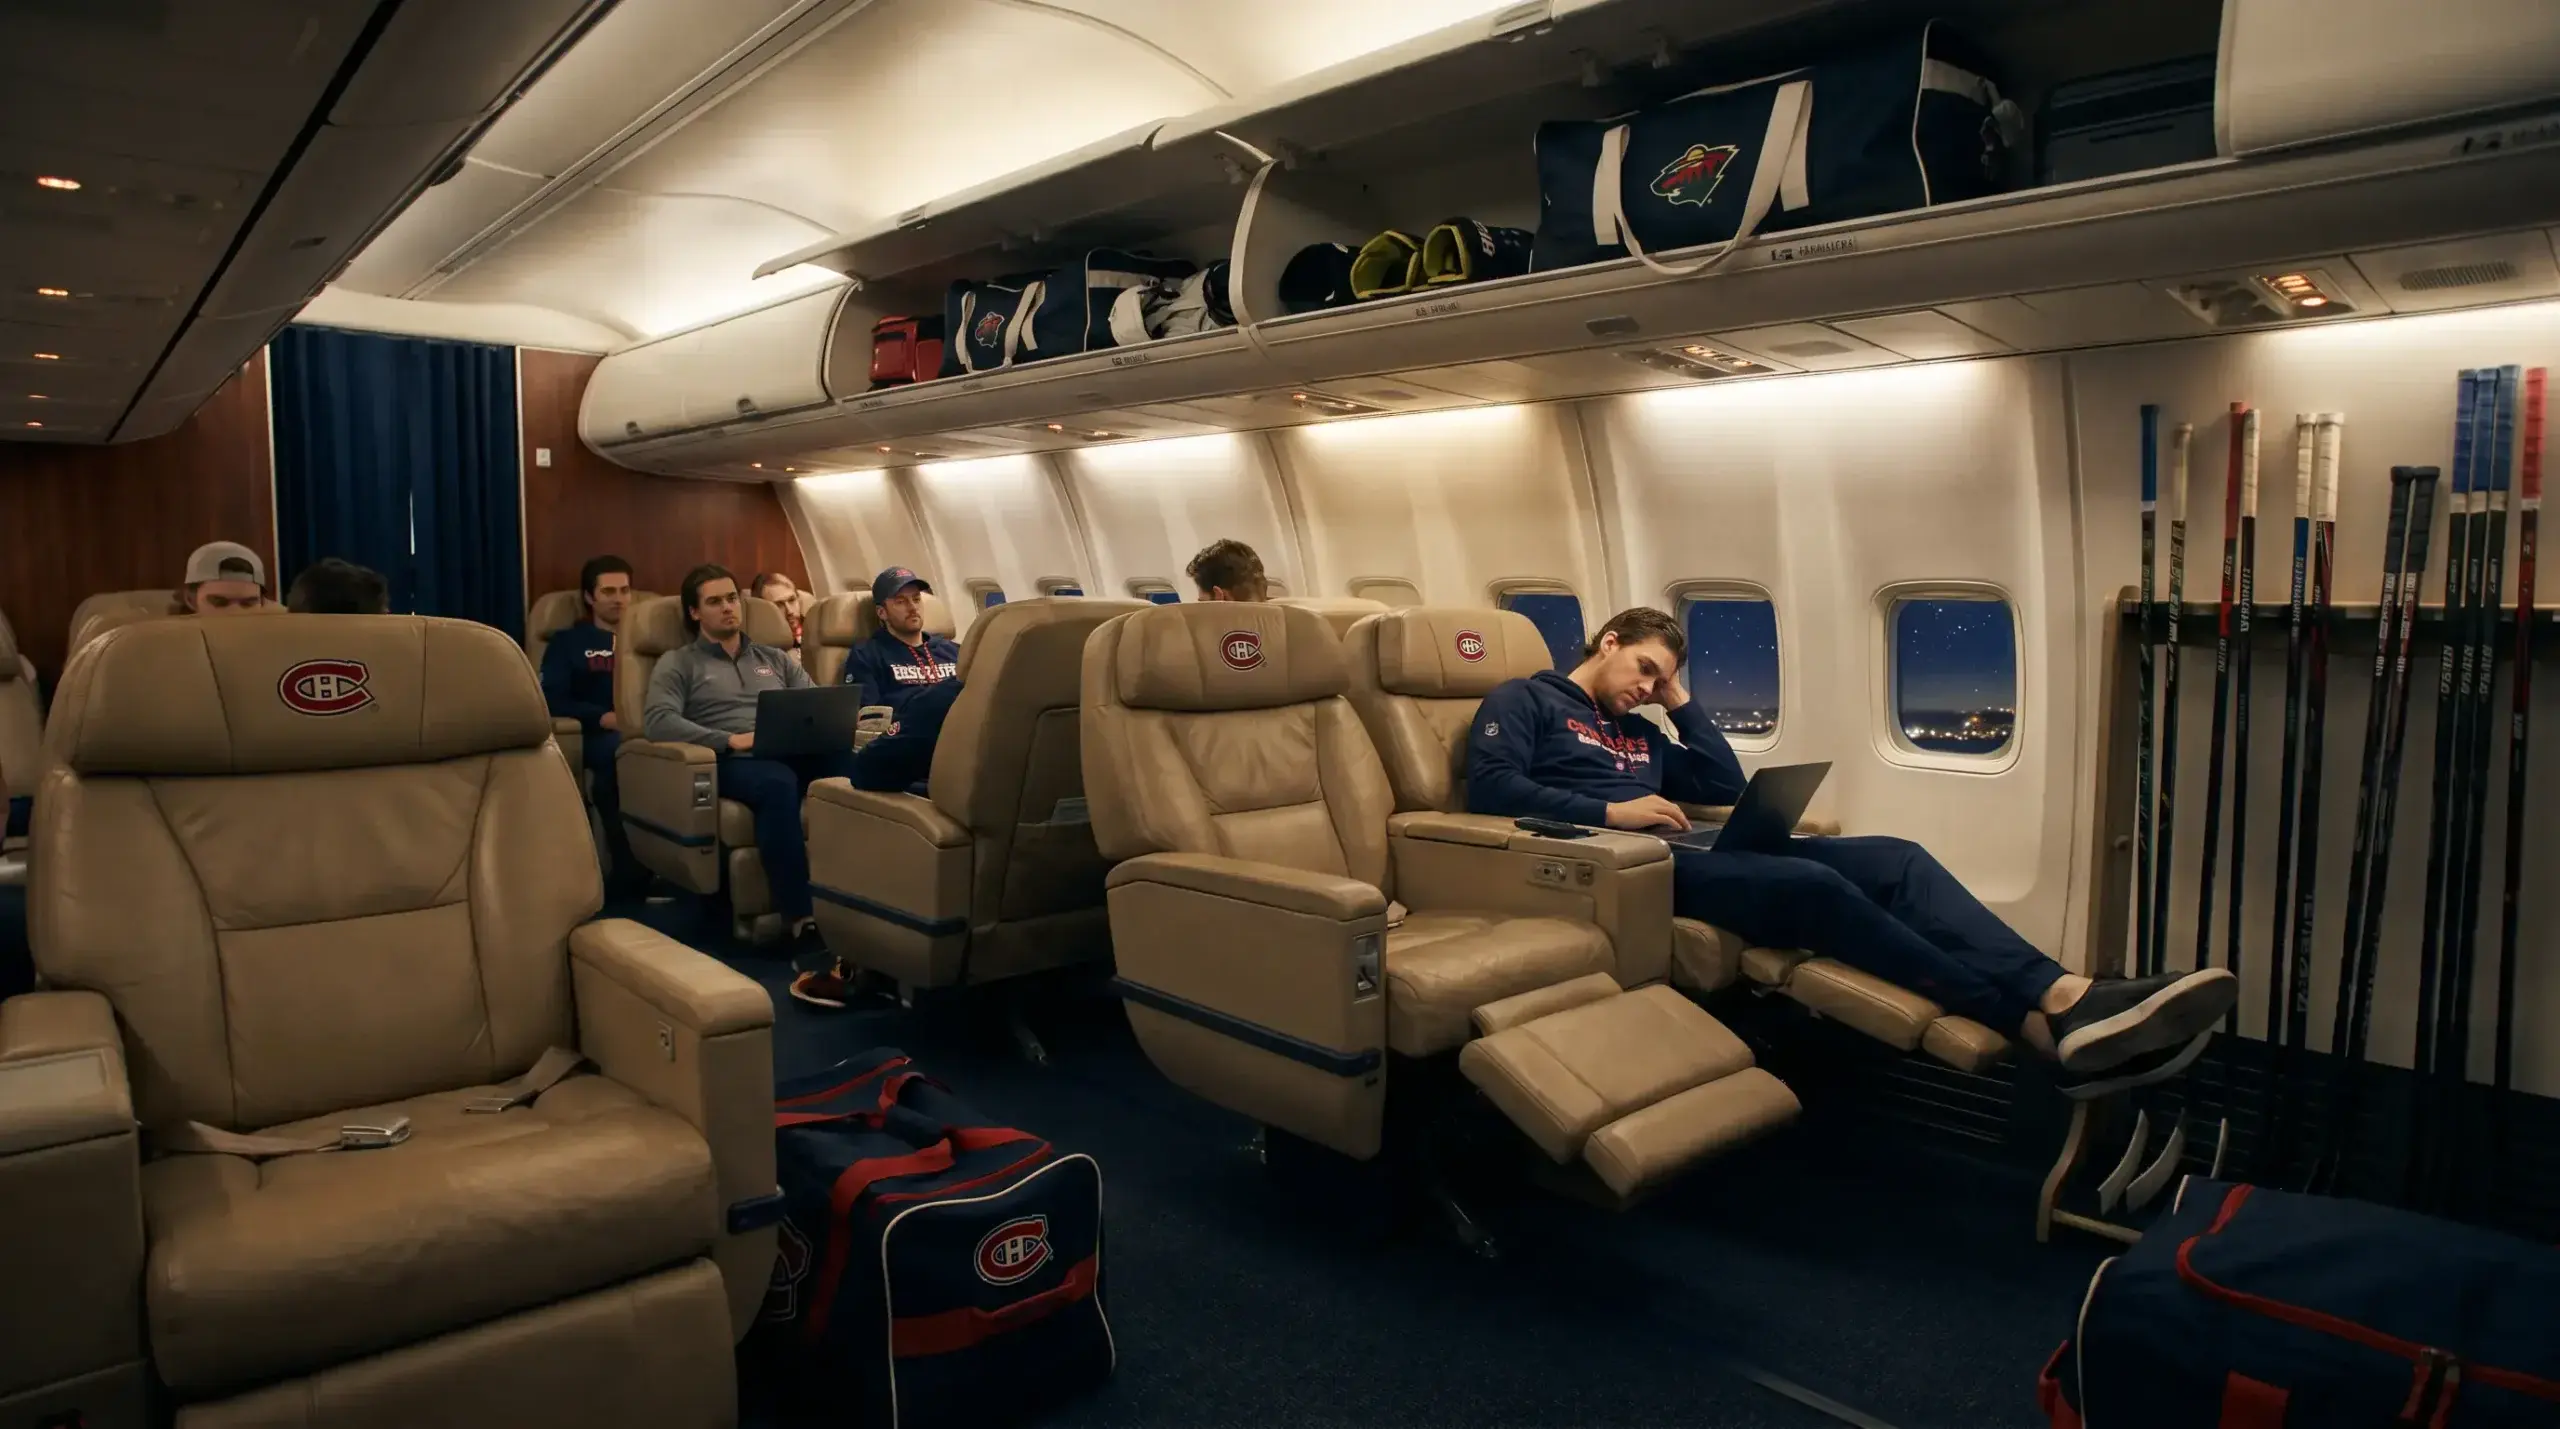
Step two: assess the travel. A team playing in Chicago on Saturday night and in Winnipeg on Sunday night is in a worse position than a team playing at home on both nights. Cross-time-zone travel amplifies fatigue. I categorise travel into three tiers: same city or short hop (minimal impact), moderate travel within the same time zone (some impact), and cross-time-zone travel (significant impact).
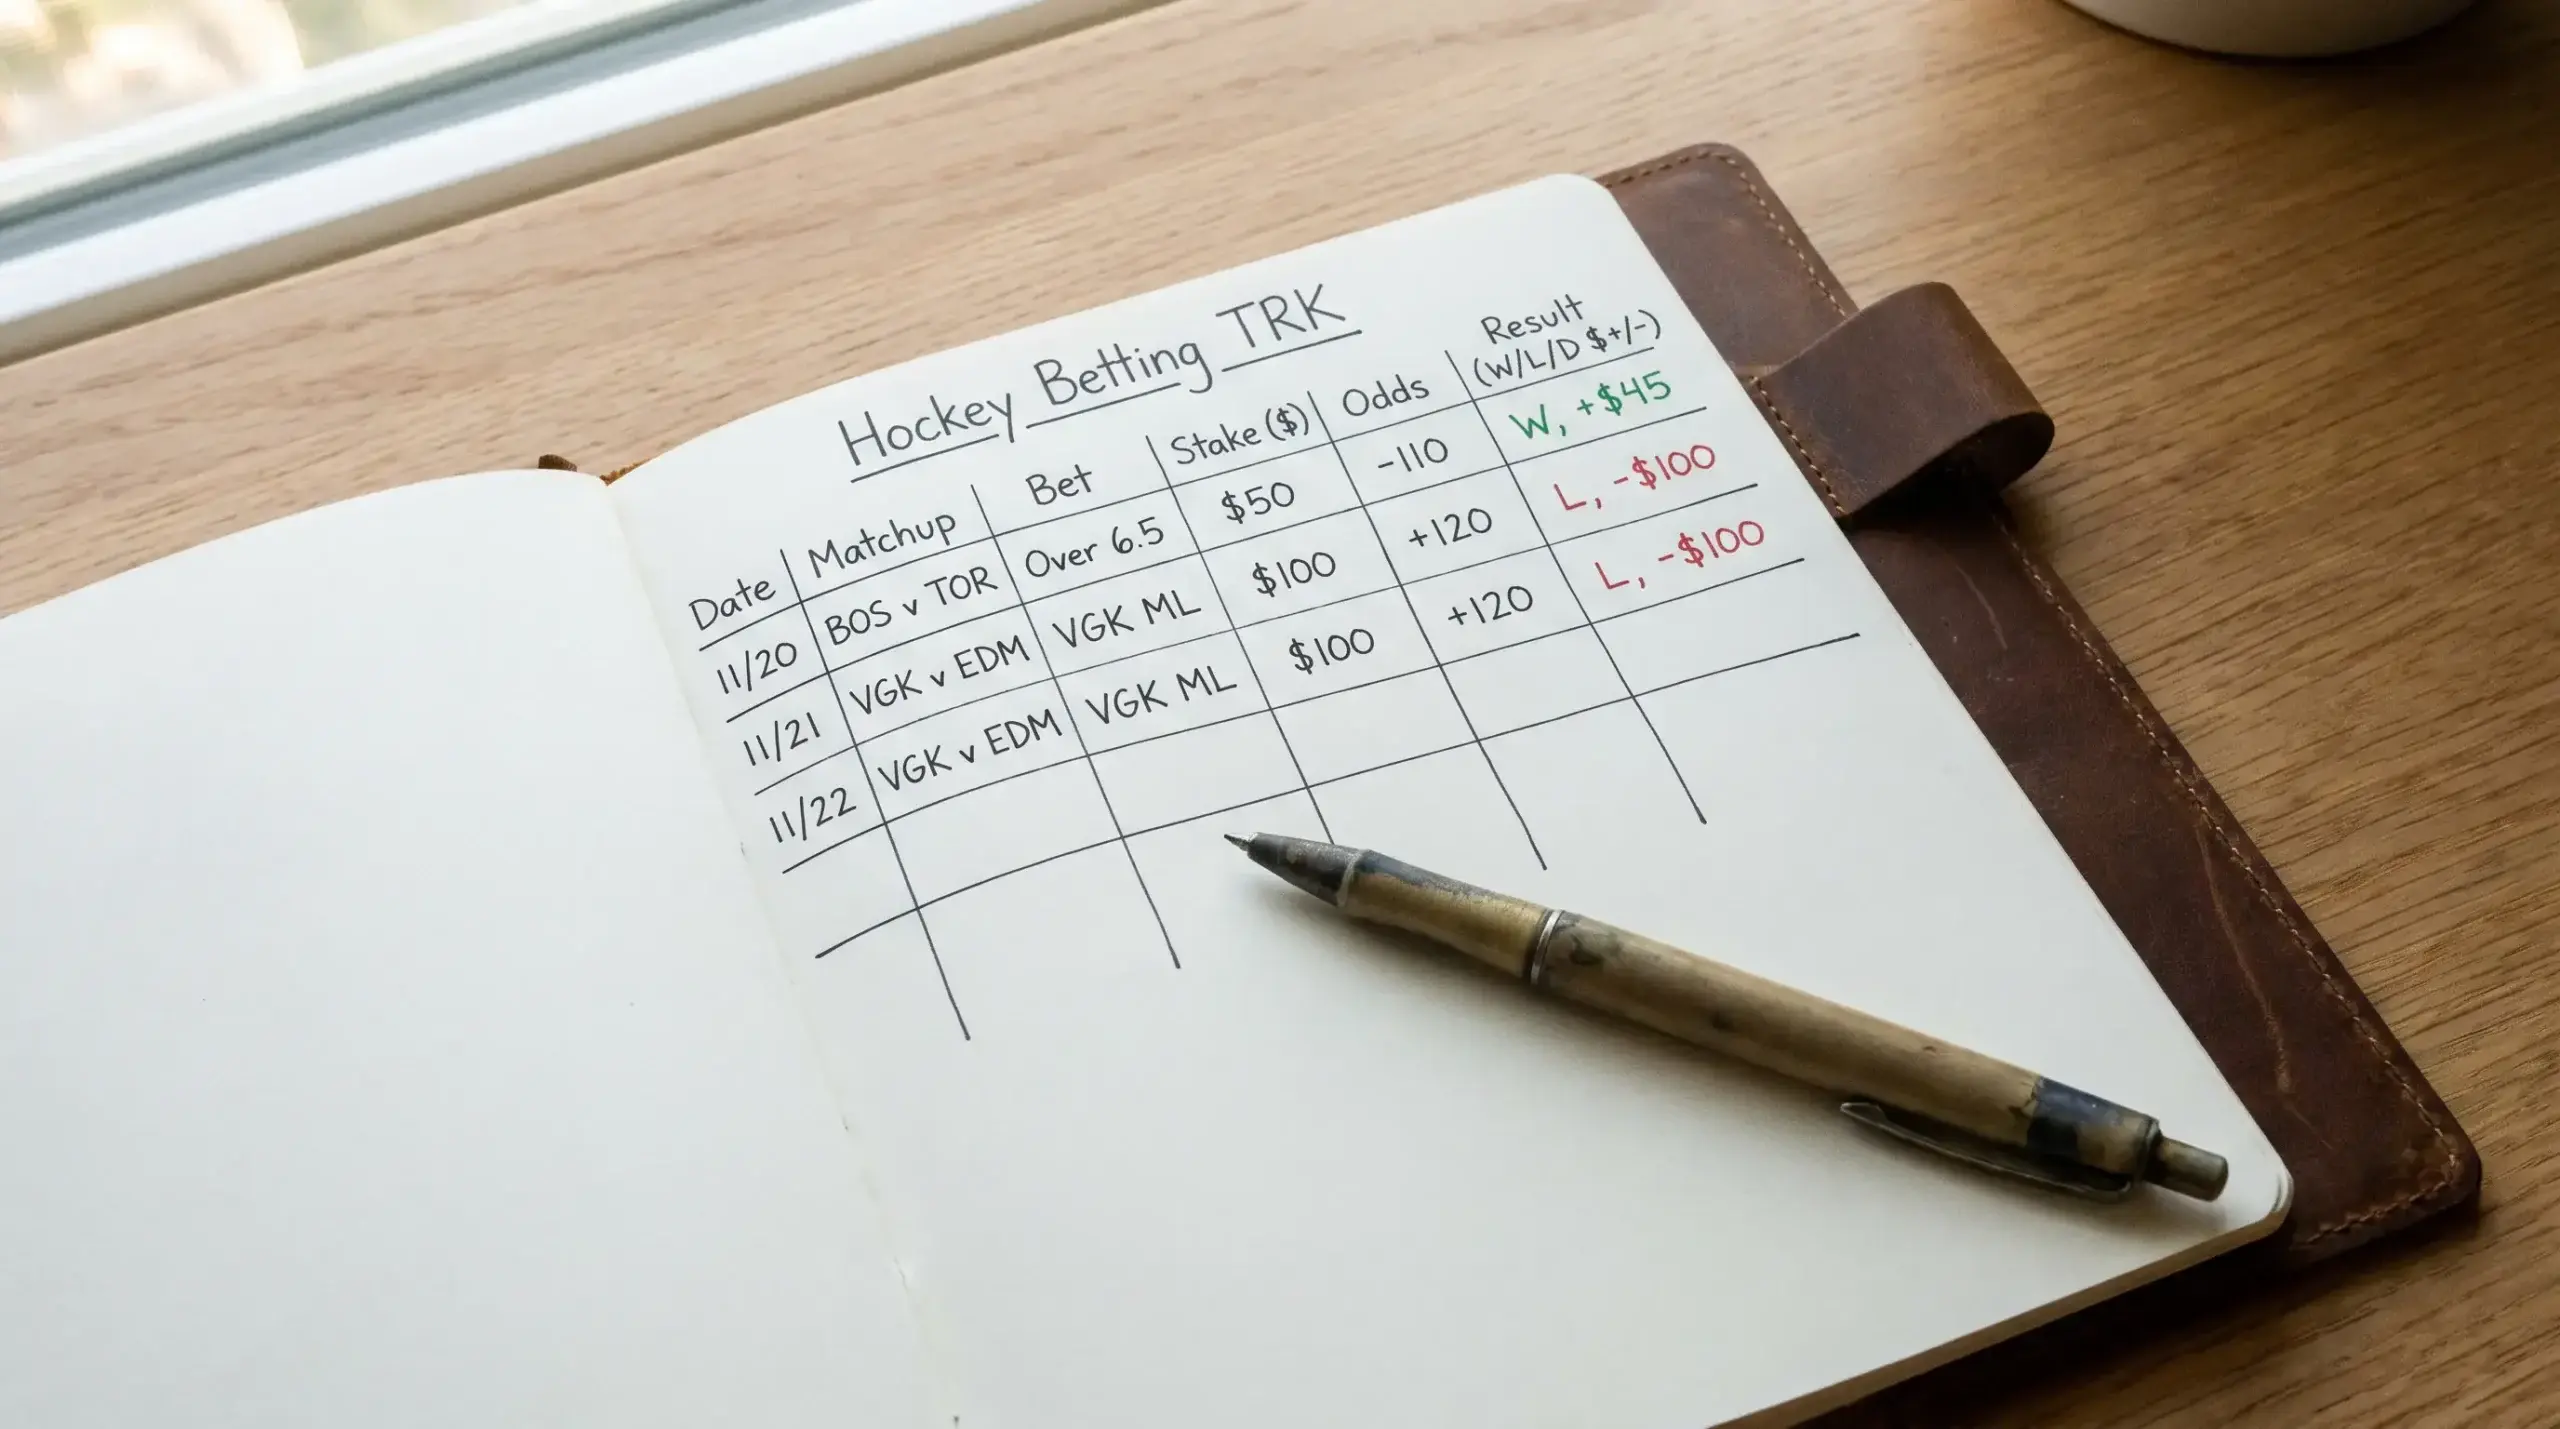
Step three: determine the likely goaltender. Check the team’s recent rotation pattern. If the starter played last night, the backup is almost certainly starting tonight. If the backup played last night, the starter may come back or the team might use a planned rest strategy.
Step four: check the opponent’s rest status. The ideal back-to-back fade targets a tired team facing a rested opponent. If both teams are on the second night of a back-to-back, the fatigue effect largely cancels out and the situation loses its edge.
Step five: evaluate the line. Has the market already adjusted for the back-to-back? Compare today’s line to what you’d expect based on the teams’ season-long performance. If the adjustment seems insufficient — for example, the team on the back-to-back is only a slight underdog when the combination of fatigue, travel, and goaltender downgrade should make them a meaningful underdog — that’s your entry point.
Step six: size the bet modestly. Back-to-back angles are small edges, not guarantees. I use flat stakes and typically risk 1-1.5% of bankroll per back-to-back play. The edge compounds over a full season of 12-15 sets per team, but no individual game offers enough edge to justify outsized risk.
