


Why a Strategy Matters More in Hockey Than in Most Sports
My first full season betting hockey, I finished up 12% on investment. I thought I’d cracked it. My second season, using the exact same approach, I finished down 8%. Same sport, same markets, same bookmakers — different result. The variance wasn’t a bug; it was the central feature of hockey betting that I hadn’t accounted for. I had picks but not a strategy, and the difference between those two things is the difference between one good year and a sustainable practice.
Hockey rewards strategic bettors more than most sports because the average sportsbook hold sits around 10.15% — that’s the margin you need to overcome just to break even. In a sport where the best teams win roughly 60% of their games and parity is enforced by the salary cap, finding consistent edges requires a framework that goes beyond picking winners. You need a system for when to bet, how much to stake, where to shop for odds, and — most importantly — when to walk away from a game that doesn’t meet your criteria.
What follows is the framework I’ve refined over six years of betting NHL and EIHL. It isn’t a secret formula or a guaranteed path to profit. It’s a structured process that maximises the probability of long-term positive results by focusing on the variables within your control: information quality, execution discipline, and bankroll management.

The Four Pillars of a Hockey Betting Framework
Every betting strategy I’ve seen fail has the same structural weakness: it’s strong on one dimension and absent on the others. A bettor might be brilliant at reading form but terrible at staking discipline. Another might line-shop obsessively but never track results to know whether their process actually works. The framework that survives contact with real markets rests on four pillars, and all four need to hold simultaneously.
The four pillars are: line shopping, staking discipline, angle identification, and record keeping. Remove any one and the framework collapses. Line shopping without good angles means you’re getting the best price on bad selections. Good angles without staking discipline means a single losing streak can wipe out months of profit. And without record keeping, you have no way to know which angles are actually generating positive expected value and which ones just feel like they should.
Line Shopping Across UK Bookmakers
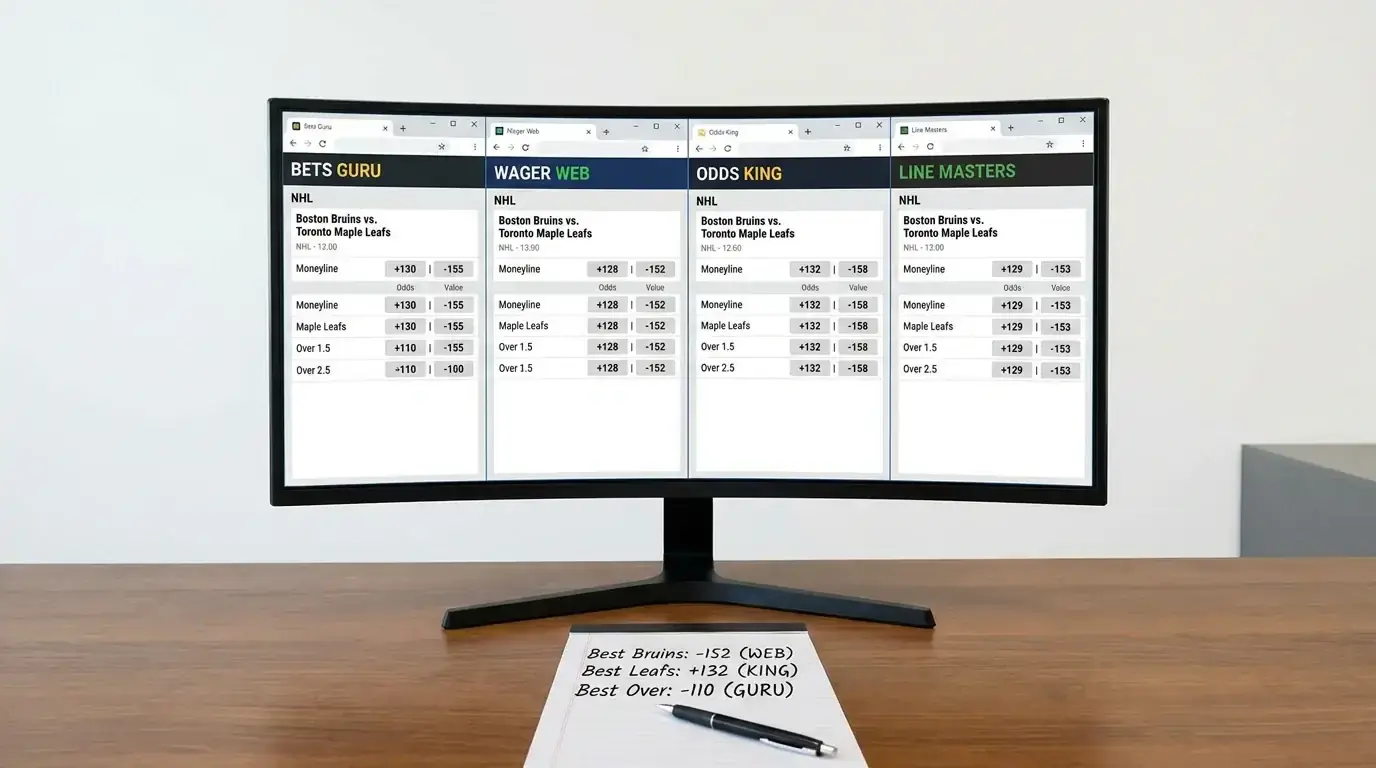
I maintain active accounts at four UK-licensed bookmakers. That number isn’t arbitrary — it’s the minimum needed to consistently find the best available price on NHL moneylines and puck lines without spending more time shopping than analysing.
New UK-facing operators have been adding niche sport markets at a rate 34% faster than mainstream sports year on year between 2024 and 2026. That expansion means more operators pricing NHL markets, more variation between prices, and more opportunities for the bettor who checks multiple sources. The variation is typically small on headline moneylines — a tick or two in decimal — but it widens on secondary markets like puck lines, period totals, and player props.
My line-shopping process takes about ninety seconds per bet. I pull up the same game at all four operators, compare the decimal odds, and take the best price. Over a season of 200 bets, this habit adds roughly two percentage points to overall ROI compared to betting at a single operator. Two percentage points doesn’t sound like much until you consider that the total edge available in a given hockey season might only be three to five percentage points above the margin. Line shopping accounts for a significant fraction of the total profit.
One nuance worth noting: the operator offering the best moneyline isn’t always the same one offering the best puck line on the same game. If I’m planning to bet both markets on a single fixture, I’ll sometimes split the action across two operators to capture the best price on each. It’s a minor optimisation, but minor optimisations compound over hundreds of bets.
Flat Stakes vs Proportional Models
I’ve tried three staking approaches over the years and settled on the simplest one. Flat staking — the same amount on every bet, regardless of confidence level — isn’t the mathematically optimal approach, but it’s the one I can actually execute consistently under pressure.
The alternative is proportional staking, where you risk a fixed percentage of your current bankroll on each bet. The advantage is that your stakes grow when you’re winning and shrink when you’re losing, which extends your bankroll’s lifespan during losing streaks. The disadvantage is psychological: staking less after a loss feels like you’re admitting defeat, and the temptation to override the system and increase your stakes is constant.
The Kelly criterion sits at the theoretical extreme — it calculates the mathematically optimal stake based on your estimated edge and the odds offered. In practice, full Kelly staking is too aggressive for hockey because your edge estimates are imprecise and the variance is high. Half-Kelly or quarter-Kelly reduces the volatility, but it also introduces complexity that creates execution errors. If you’re curious about the mathematics, the formula is straightforward, but I’d recommend paper-trading it for a full season before committing real money.
My standard stake is 1% of my starting monthly bankroll per bet. At the start of each month, I recalculate based on my current balance. During the month, every bet is the same nominal amount. This approach sacrifices some theoretical edge for the consistency and simplicity that prevent me from making staking errors when I’m tired, frustrated, or overconfident — which, during a 200-bet NHL season, happens more often than anyone wants to admit.

Data-Driven Betting Angles
Having a framework is necessary but not sufficient. You also need angles — specific, repeatable situations where your assessment of probability diverges from the market’s assessment by enough to overcome the margin. These aren’t hot tips or gut feelings. They’re patterns grounded in data that produce measurable edge over a large sample of bets.
I work with three primary angles for NHL betting, each rooted in a different type of information asymmetry. The first two relate to specific pre-game variables; the broader approach to advanced statistics feeds into all three.
Goaltender Confirmation Windows
The goaltender confirmation window is the most reliably profitable angle in my entire hockey betting process. The implied probability shift when a backup starts instead of the expected number one runs between 3 and 5 percentage points — a figure I’ve seen confirmed repeatedly by the odds traders who set NHL lines at major sportsbooks. That swing is larger than the typical edge available on any other single pre-game factor, which is why this angle sits at the top of my daily checklist.
My approach is to build my assessment of each game assuming both teams start their expected number-one goaltender. I set my probability estimates, identify which games offer potential value, and then wait. Goaltender confirmations arrive after morning skate, typically between 3:30 and 5:00 PM GMT for evening starts. When a backup is confirmed and the market adjusts, I recalculate my probability and compare it to the new line.
The value often appears on the opposite side from what you’d expect. When a team announces their backup, the market moves against that team. But the market sometimes overreacts, especially for teams whose backup goaltender has been performing well in recent starts. If the backup’s actual save percentage over the last ten appearances is close to the starter’s, but the market has priced in a full 5-point probability shift, the overreaction creates value on the team with the backup in net.
The discipline required is patience. Some nights, no goaltender confirmation changes my assessment enough to generate a bet. That’s fine. The angle produces two to four actionable opportunities per week during the NHL season — enough volume to be meaningful, but not so much that you’re forcing the framework to produce results it can’t deliver.

Schedule Spots and Fatigue
The NHL schedule produces more exploitable rest-versus-fatigue mismatches than any other major sport, and the reason is structural: 82 games in roughly 180 days, with regular back-to-back sets, cross-continental travel, and time zone changes that compound the physical load.
I track schedule spots two weeks in advance using the full NHL fixture list. The situations I look for are specific: a team playing the second game of a back-to-back on the road, ideally after westbound travel, against a team with two or more days of rest. That combination — cumulative fatigue on one side, rest advantage on the other — produces a measurable performance gap. The fatigued team generates fewer high-quality scoring chances, gives up more goals, and wins less frequently than their season-long metrics would predict.
The market accounts for obvious schedule spots. A team on the second night of a back-to-back will be priced as a slightly larger underdog than their form alone would suggest. The edge comes from evaluating how well the market has priced the specific degree of fatigue. A back-to-back where the team flew from Los Angeles to Vancouver overnight is different from one where they played at home and then play again at home the next night. The travel component, the time zone shift, and the roster implications — particularly whether the goaltender will be rotated — all affect the actual performance impact, and the market doesn’t always differentiate between these sub-categories with sufficient granularity.
Integrating Advanced Stats into Your Process
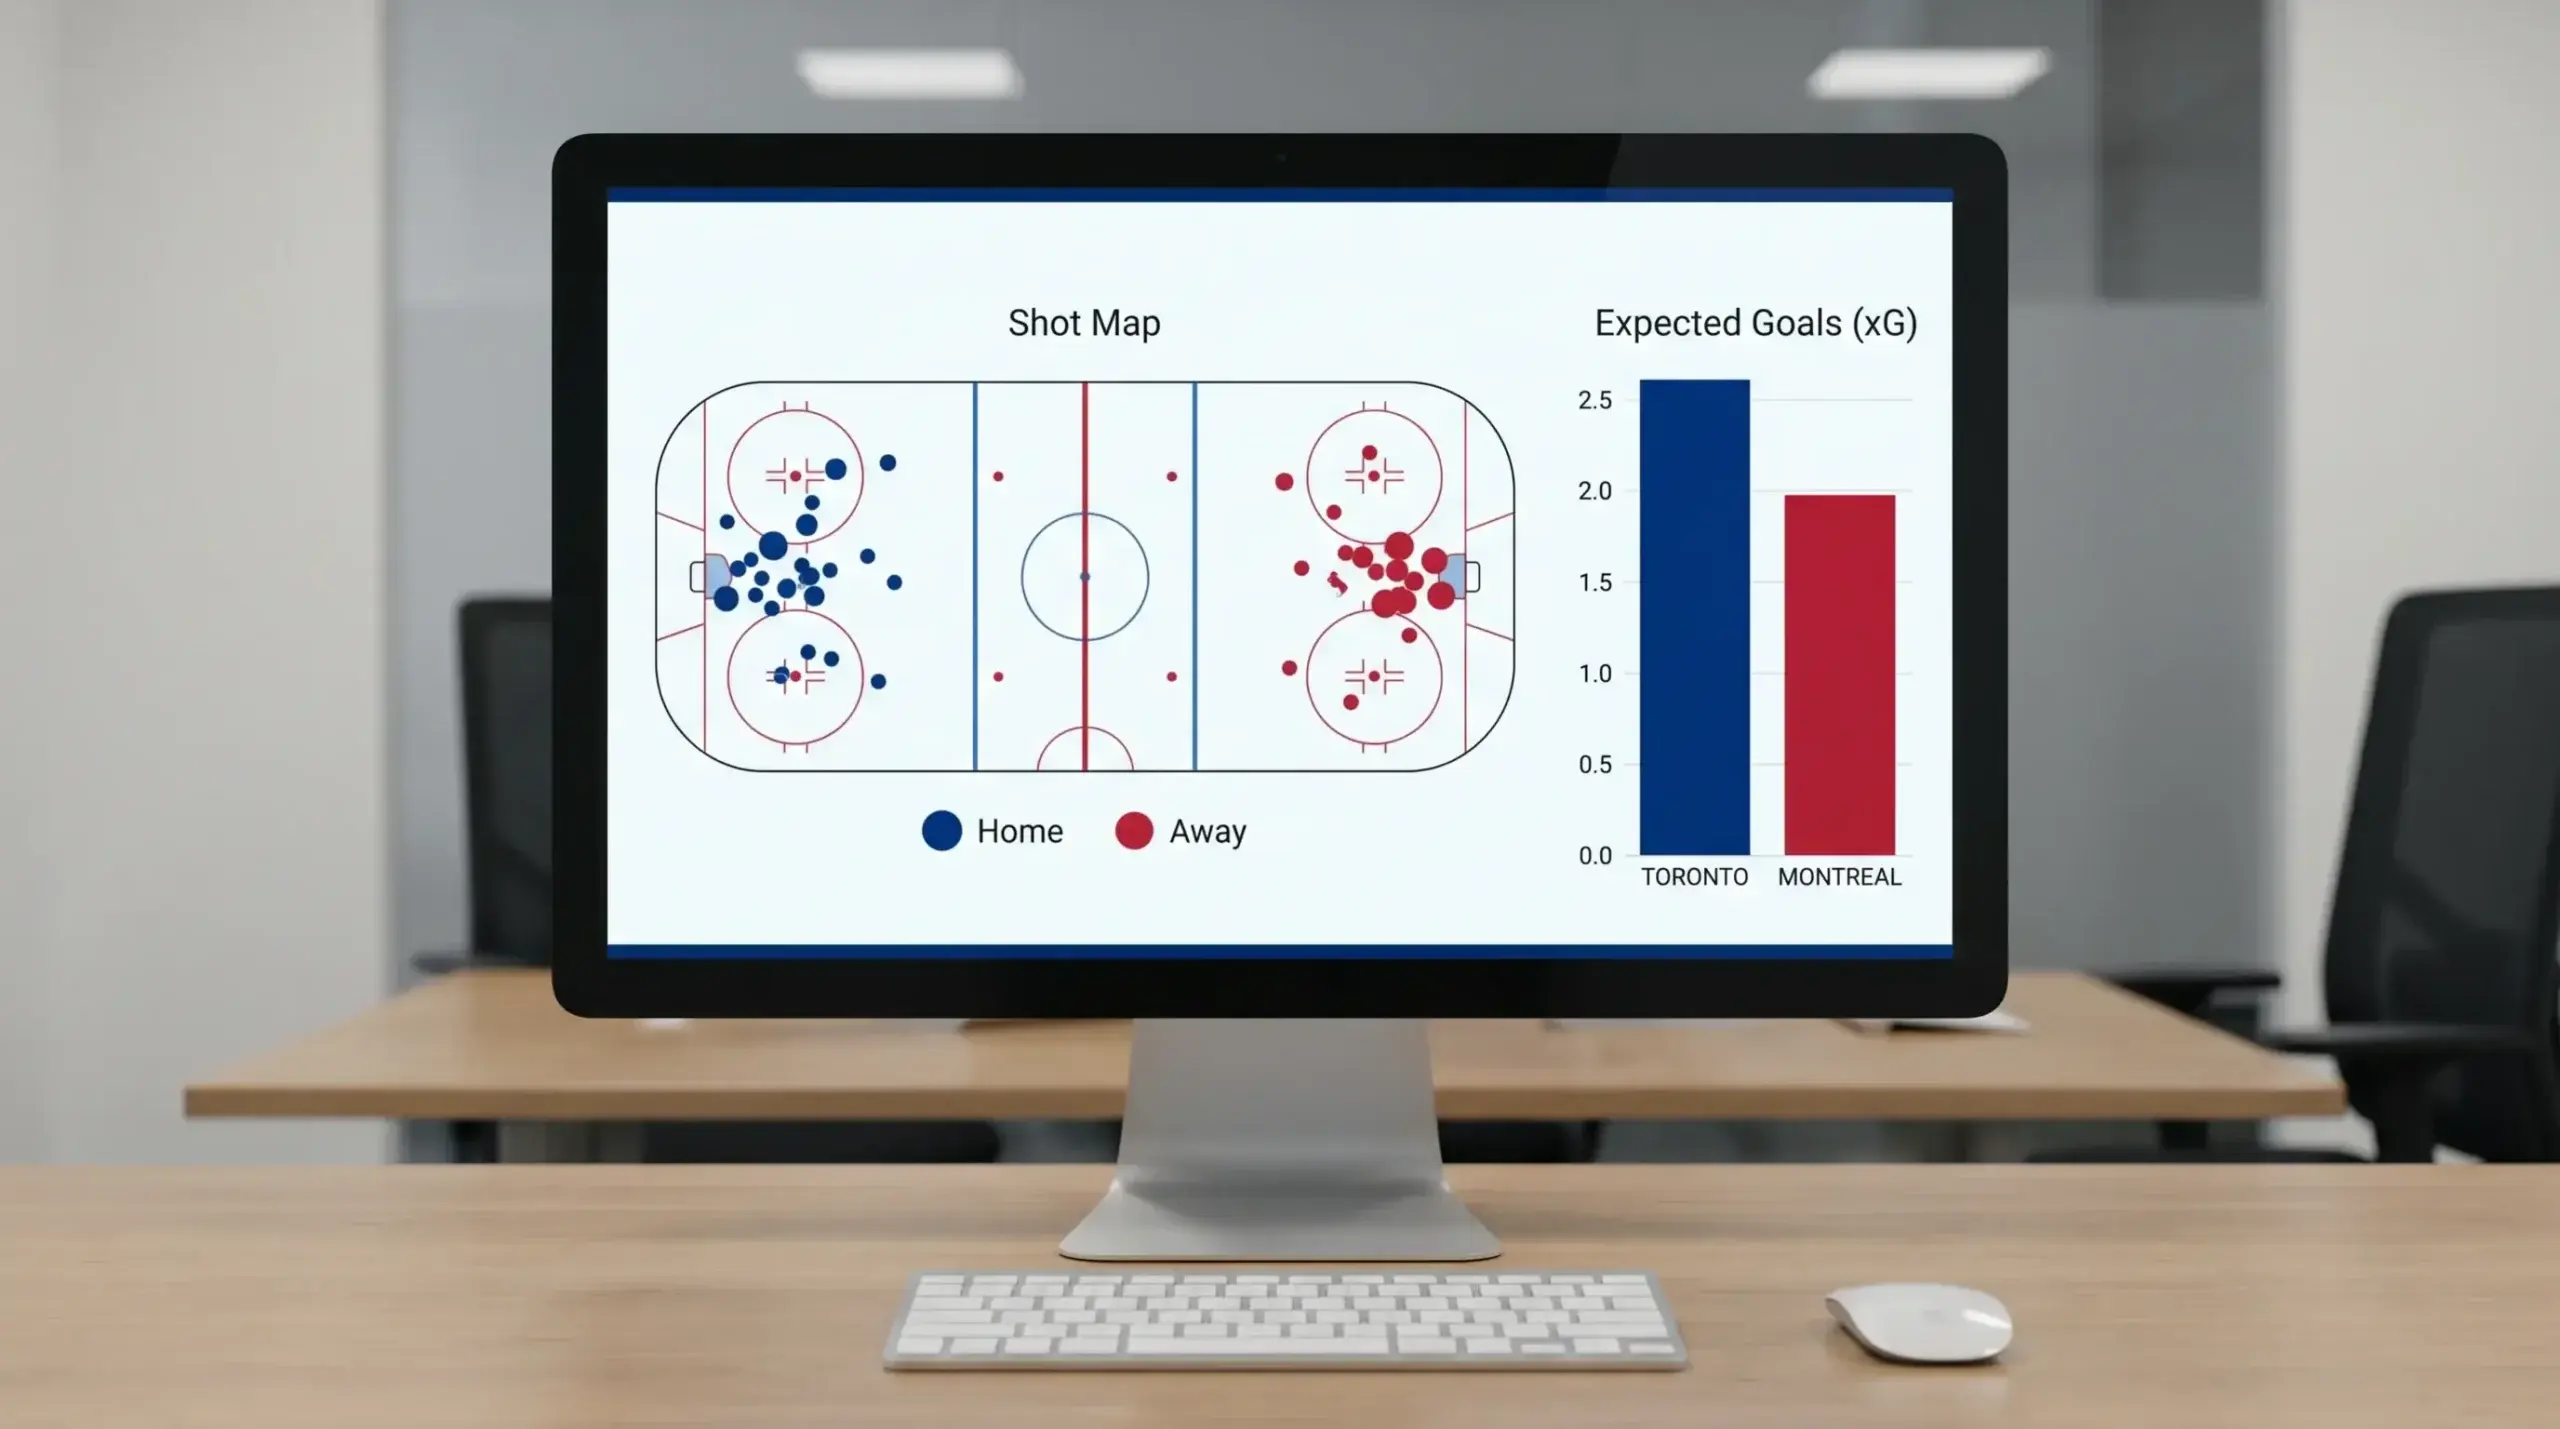
Three years ago I started incorporating expected goals — xG — into my pre-game process, and it changed how I evaluate every NHL matchup. The concept is simple: xG assigns a probability to each shot based on its location, type, and game situation, then sums those probabilities to estimate how many goals a team “should” have scored based on their shot quality. A team that generates more xG than actual goals is creating chances but getting unlucky. A team that scores more than their xG suggests is riding unsustainable finishing rates.
The reason xG matters for betting is that the market prices actual results, not underlying process. If a team has won five straight games but their xG data shows they’ve been outplayed in four of them, the market is pricing them based on the winning streak. When regression hits — and in hockey, it always does — the correction creates value on the other side.
Corsi and Fenwick are the possession proxies I use alongside xG. Corsi counts all shot attempts — blocked, missed, and on target. Fenwick excludes blocked shots. Neither is a perfect measure of quality, but teams that consistently generate more shot attempts than they concede are, over large samples, more likely to win. When a team’s Corsi percentage is high but their points percentage is low, the discrepancy usually corrects over the remaining season. That’s when I start looking for value on their moneyline.
The average NHL regular season viewership hit 546,000 in the 2025-26 season — the league’s best number in fourteen years — and the growing audience has brought more sophisticated analytics coverage with it. Free data sources for xG, Corsi, and Fenwick are now widely available, which means the informational barrier that once gave analytics-savvy bettors a significant edge has lowered. The edge hasn’t disappeared, but it’s shifted from having the data to interpreting it correctly. Anyone can look up a team’s xG differential. Fewer people know how to contextualise it within a specific matchup, account for roster changes since the data was collected, and convert the assessment into a probability that can be compared against the bookmaker’s line.
I don’t build formal statistical models. My process is more like an informed checklist: I check each team’s rolling twenty-game xG differential, their Corsi percentage at even strength, their power play and penalty kill efficiency, and their goaltender’s save percentage compared to expected save percentage. These four inputs, combined with the schedule and goaltender factors, produce a probability estimate that I compare to the market. The estimate is imprecise, but consistently better than ignoring the data entirely — which is still what most hockey bettors do.
Tracking Results and Measuring Your Edge
If you aren’t tracking your results in a spreadsheet, you don’t have a strategy. You have a hobby. I’ve seen bettors who swear they’re profitable refuse to look at their actual numbers because, on some level, they know the results won’t confirm the narrative they’ve constructed.
My tracking sheet records eleven data points for every bet: date, teams, league, market type, my estimated probability, the implied probability from the odds, the stake, the odds, the result, the profit or loss, and a notes field for context (goaltender confirmed late, key injury, schedule spot). At the end of each month, I calculate overall ROI, ROI by market type, ROI by angle, and closing line value — which measures whether the odds I bet at were better or worse than the closing line.
Closing line value is the single most important metric for evaluating whether your process generates edge. If you consistently bet at prices that are better than the closing line — meaning the market moves in your direction after you place your bet — it suggests your process is identifying value before the market does. A positive closing line value over 100+ bets is strong evidence that your strategy works, even if your short-term results are negative due to variance.
The notes field is where long-term improvement lives. When I review a losing month, I look for patterns in the notes. Was I betting too many back-to-back games where the market had already fully priced the fatigue? Was I overestimating the impact of goaltender changes for teams with strong backup depth? Was I ignoring line movement that should have told me the sharp money disagreed with my assessment? These patterns only emerge when you have consistent, detailed records to analyse.
The average sportsbook hold of 10.15% means you need to generate more than 10% edge across all your bets just to break even. Tracking makes that target concrete rather than abstract. When you can see exactly which angles produce positive expected value and which don’t, you can reallocate your attention and stakes accordingly. Without tracking, you’re optimising blind.

How to Adjust Strategy Across the NHL Season
The NHL season isn’t a monolithic block. It passes through distinct phases, each with its own dynamics, and a strategy that works well in January might underperform in March. The bettors who adjust their approach across the season’s arc outperform those who apply the same framework from October to June.
October and November are the hardest months for data-driven betting because the sample sizes are tiny. Teams have played ten to twenty games, which isn’t enough to trust any statistical trend at the team level. During this phase, I rely more heavily on pre-season roster assessments, off-season moves, and coaching changes than on in-season performance data. I also reduce my bet volume — fewer bets at standard stakes, because the uncertainty premium is highest when the data is thinnest.
December through February is the sweet spot. Teams have played 35 to 55 games, statistical trends have stabilised, and the market is pricing based on a mix of pre-season expectations and in-season results. When those two sources diverge — when a team’s actual performance is significantly better or worse than what the pre-season models projected — the market often lags in updating. That lag is where the best value appears, and I increase my bet volume during this window to capitalise on it.
March introduces the trade deadline, which reshuffles rosters across the league. Deadline deals inject uncertainty into every team affected, and my approach is conservative: I reduce exposure to teams involved in major trades until two or three games have passed and the new roster dynamics become visible in the data. The playoff race also intensifies motivation asymmetry — teams fighting for a Wild Card spot play with a measurably different level of urgency than teams that have already clinched or been eliminated, and that motivation gap isn’t always priced accurately.
April through June is playoff season, where the strategy shifts fundamentally. I reduce bet frequency but increase my research per game. The best-of-seven format compresses variance, which should make betting easier in theory but actually makes it harder because the bookmaker’s pricing improves too. I focus on series props — series correct score, series to go to seven games — rather than individual game moneylines, because the series-level markets offer more structural opportunities for analytical bettors to find pricing inefficiencies.
