


Corsi and Fenwick: The Metrics Bookmakers Watch
Three seasons ago, I backed a team sitting in a playoff spot despite an ugly goal differential. They looked fine on the standings page, but their Corsi — a measure of shot attempt differential — sat at 44%. That meant their opponents were generating 56% of all shot attempts when they were on the ice together. The team was surviving on elite goaltending and a shooting percentage that was bound to regress. Sure enough, they collapsed in January. Corsi told me what the standings couldn’t: this team’s process was broken.
NHL average viewership reached 546,000 per game in 2025-26, a 14-year high, and the growing analytical sophistication of the hockey audience has pushed possession metrics into the mainstream conversation. Corsi and Fenwick are the two foundational possession metrics in hockey analytics, and both are directly applicable to betting decisions. They measure slightly different things, they have different strengths and weaknesses, and knowing when to use each one sharpens your handicapping.
What Corsi Measures and How to Interpret CF%
Corsi counts all shot attempts — shots on goal, missed shots, and blocked shots — by both teams during even-strength play. Corsi For (CF) is the total shot attempts by your team; Corsi Against (CA) is the total by the opponent. Corsi For Percentage (CF%) divides CF by the sum of CF and CA, giving you the team’s share of total shot attempts.

A CF% of 50% means a team is generating exactly as many shot attempts as it’s allowing — perfectly even possession. A CF% above 52% indicates a team that consistently controls play by spending more time in the offensive zone and generating more shot attempts. A CF% below 48% indicates a team that’s being outplayed in the shot attempt battle and spending too much time defending.
Why does this matter for betting? Because CF% is one of the most stable and predictive team-level metrics in hockey. A team’s CF% over a 20-game sample is more predictive of future results than its win-loss record over the same period. This happens because CF% strips away the noise of goaltending variance and shooting percentage fluctuation. It measures the underlying process — territorial control — rather than the outcome, which is subject to randomness.
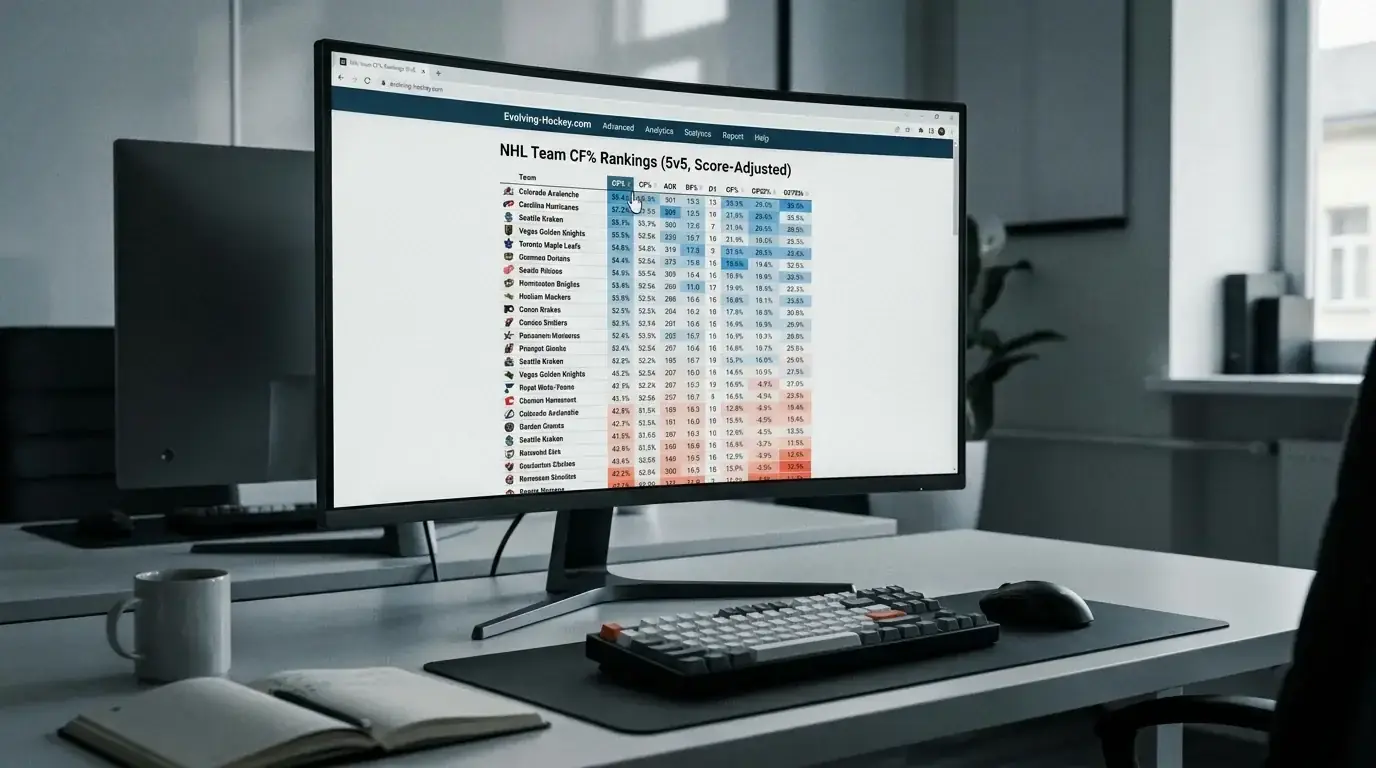
I use CF% primarily for moneyline analysis. When two teams meet and Team A has a CF% of 54% while Team B sits at 47%, Team A is consistently creating more offensive opportunities and limiting defensive exposure. If the bookmaker’s moneyline doesn’t adequately reflect that CF% gap, there’s potential value on Team A. The adjustment isn’t dramatic — CF% is one input, not the only input — but it provides a data-driven baseline that gut feelings can’t replicate.
Fenwick vs Corsi: When to Use Which
Fenwick is identical to Corsi except it excludes blocked shots. Fenwick counts only shots on goal and missed shots. The logic behind this exclusion is that blocked shots are partly a product of the defending team’s strategy — a team that blocks aggressively will inflate its opponent’s Corsi Against even if the offensive team isn’t generating dangerous chances. By removing blocked shots, Fenwick provides a “cleaner” measure of unblocked shot attempts.

In practice, Corsi and Fenwick correlate very highly with each other. Over a full season, a team’s CF% and FF% (Fenwick For Percentage) typically agree within 1-2 percentage points. The situations where they diverge are specific and worth noting: teams that play a shot-blocking style (think a defensive-minded coach who instructs players to sacrifice their bodies) will have a lower Corsi Against than Fenwick Against, because the blocked shots inflate the Corsi denominator.
For betting purposes, I default to Corsi because it’s more widely available, has a larger sample size (more events per game), and is the industry standard that most analytical discussions reference. I switch to Fenwick when I’m analysing a specific matchup where one team is known for extreme shot-blocking tendencies, because Fenwick gives a more accurate picture of the unblocked shot attempt battle in those cases.
Neither metric is superior in all situations. They’re complementary tools that measure slightly different aspects of the same underlying concept — territorial control and shot generation. Using both and noting where they diverge for a specific team or matchup adds depth to your analysis.
Applying Possession Metrics to Hockey Betting Decisions
NHL totals typically open around 6 or 6.5, and possession metrics help you assess whether a specific matchup will play above or below that line. A game between two teams with CF% above 52% is likely to feature more shot attempts, more scoring chances, and a higher probability of going over the total — but only if neither team has an elite goaltender who suppresses conversion rates. Combining CF% with goaltender save percentage gives you a more complete picture than either metric alone.

For live betting, possession metrics are even more valuable. Most analytics sites update Corsi data in real time during games, showing the shot attempt differential by period. If a team trails 1-0 after the first period but dominated the shot attempt battle 18-9, their expected goals data likely supports a comeback. The live moneyline might overreact to the scoreline without accounting for the possession dominance. That disconnect between the score and the process is where live betting value lives.
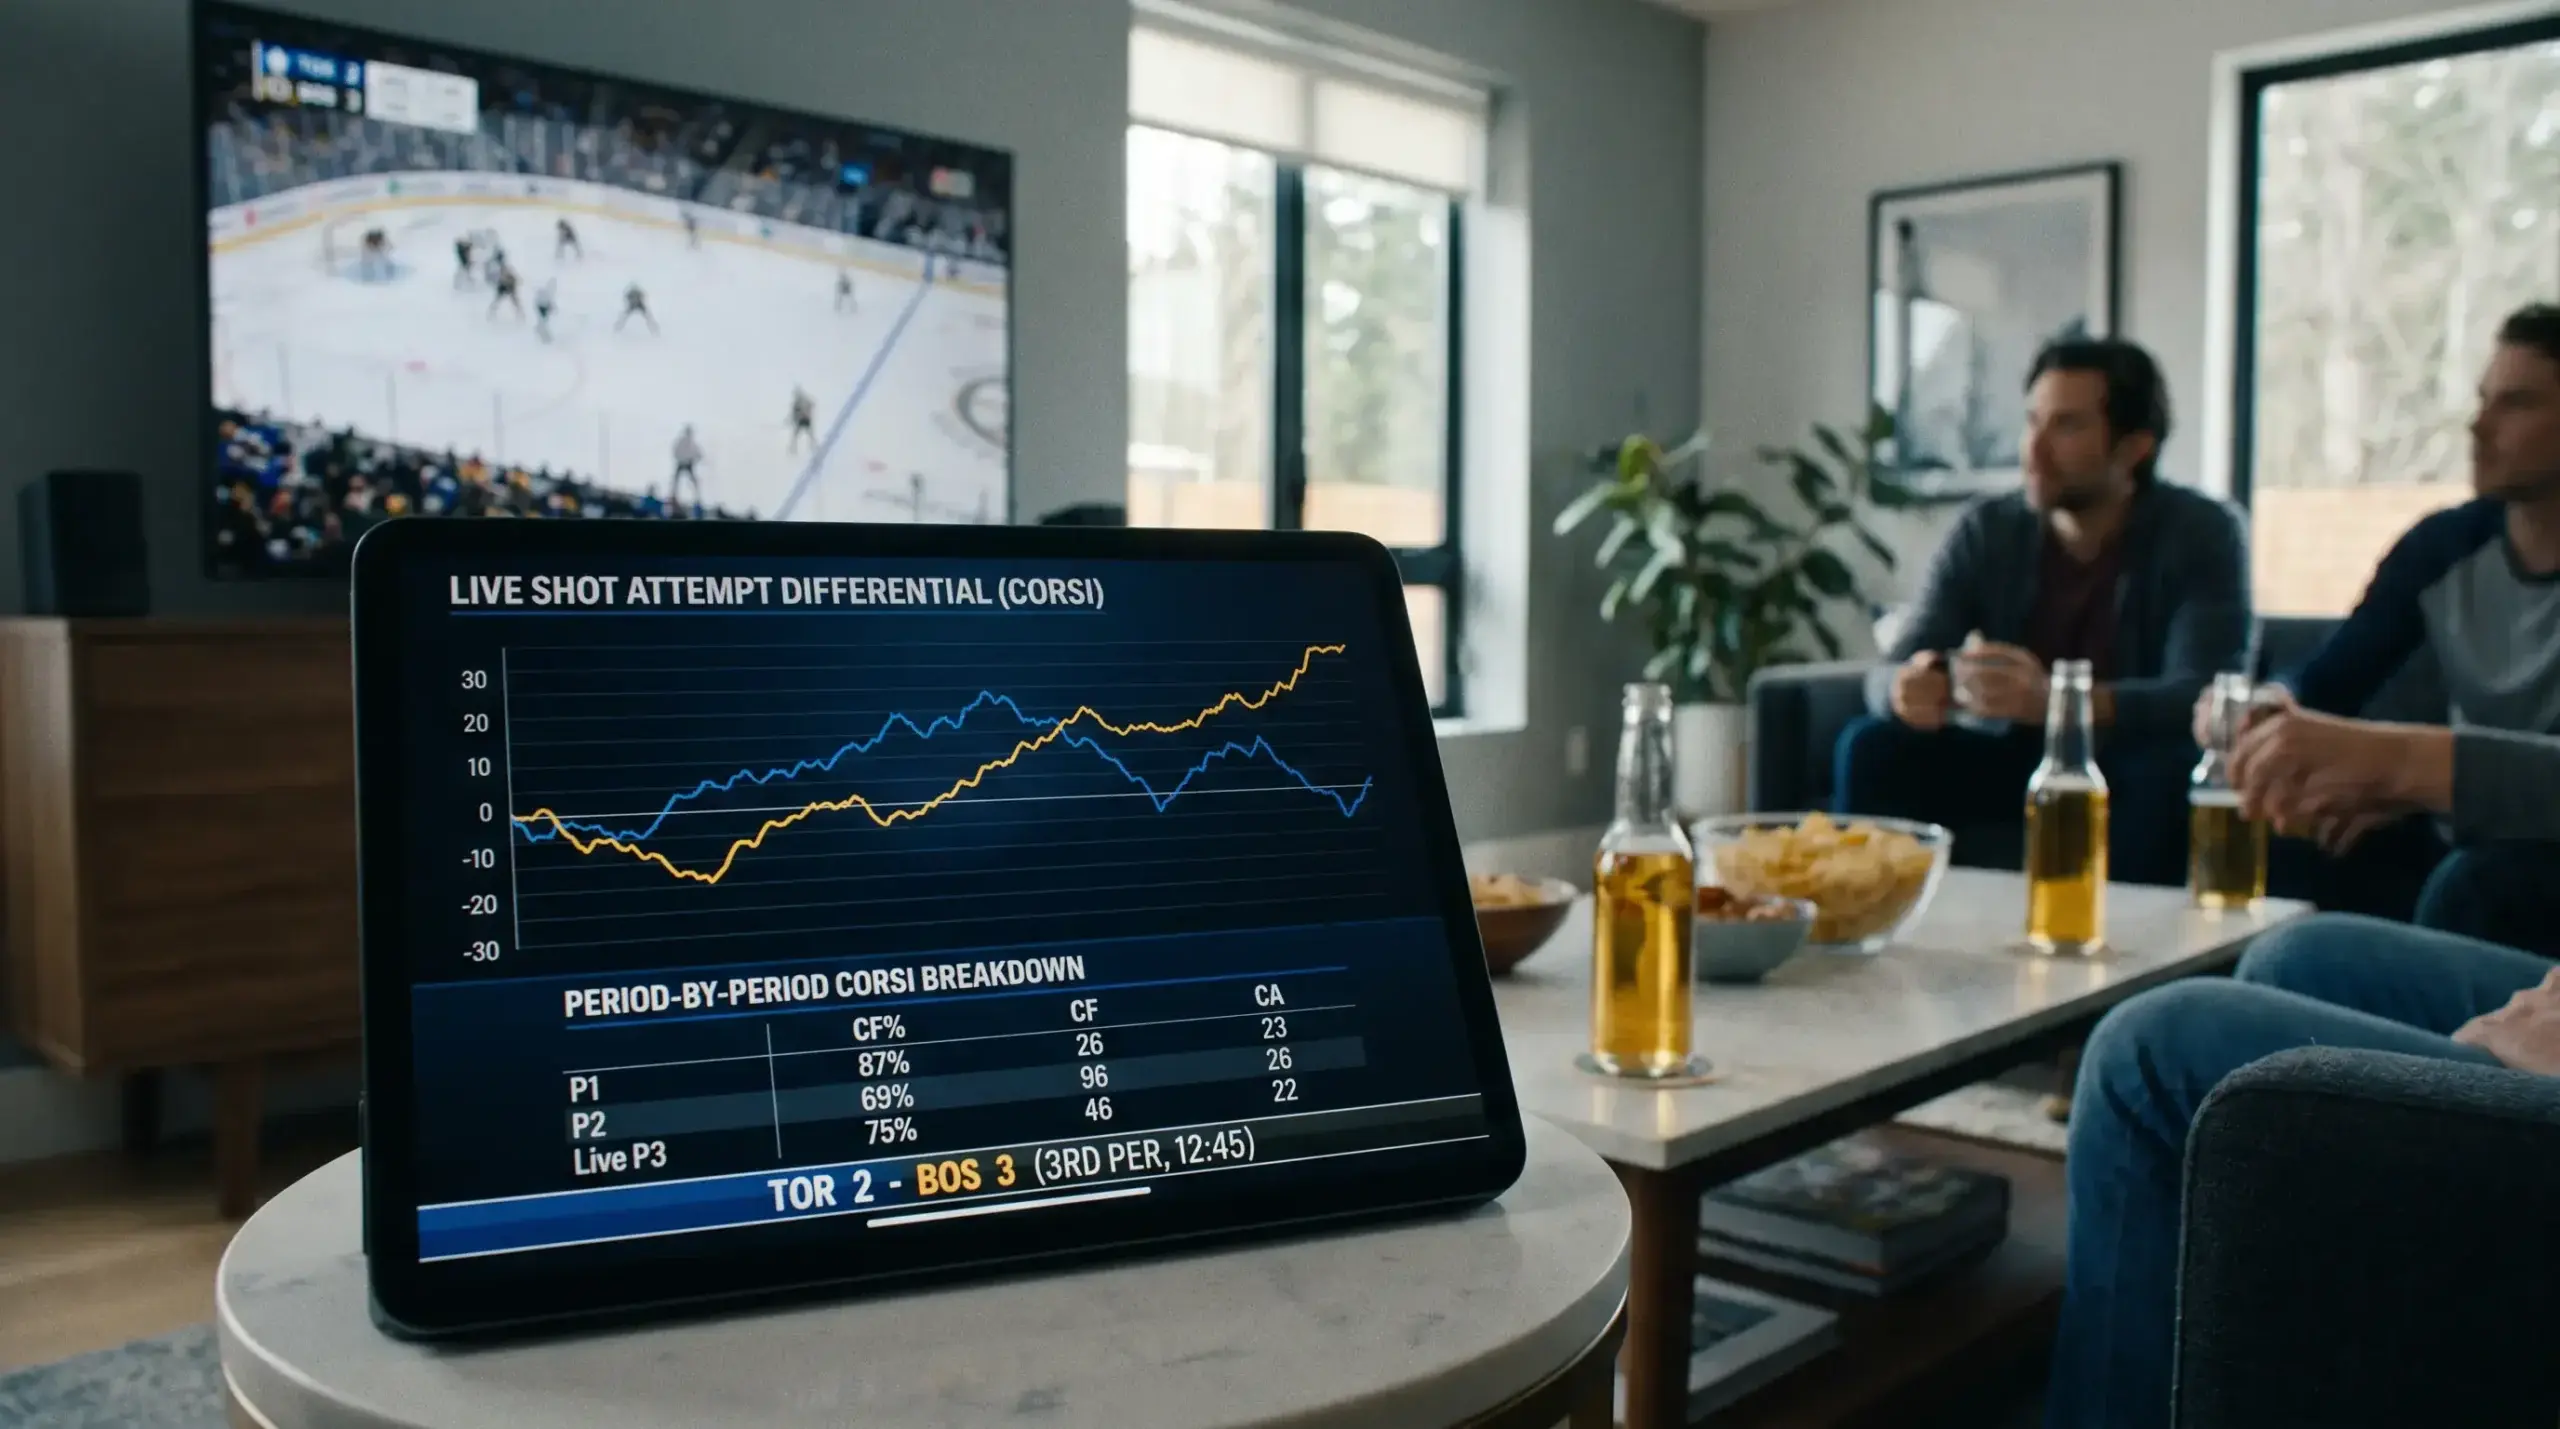
One important caveat: Corsi and Fenwick don’t account for shot quality. Ten shot attempts from the perimeter are not equivalent to ten shot attempts from the slot. A team can have a stellar CF% while generating mostly low-danger chances, which inflates the metric without translating into scoring. This is why I use Corsi as a first filter, not a final answer. If a team has a CF% above 52%, they pass the first screen. I then check their expected goals data to determine whether those shot attempts are coming from dangerous areas. A team with high CF% and high xG is genuinely controlling play. A team with high CF% but low xG is generating volume without quality.
Possession metrics are the backbone of data-driven hockey betting. They’re free, they’re updated daily, and they provide insights that are invisible in the standings or on the highlight reel. Learning to read CF% and FF% won’t make you profitable overnight, but it will give you a structural advantage over the majority of bettors who make decisions based on team names, recent scores, and gut instinct.
