
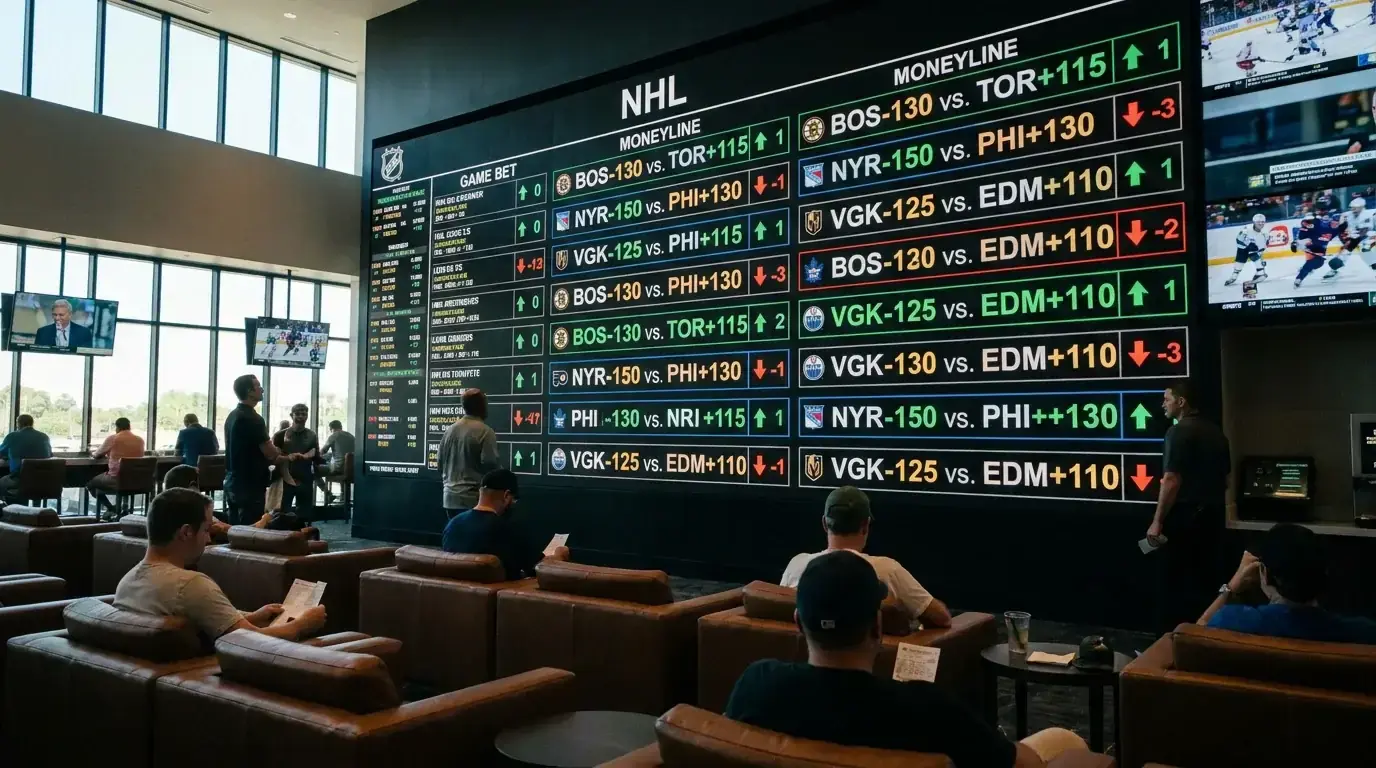

What Line Movement Tells You That the Odds Alone Cannot
Last November, I noticed a moneyline drifting from -140 to -160 on an NHL game with no public news to explain the shift. No injury report. No goaltender change. No weather event. But someone — or several someones — had bet enough money on one side to move the line. Forty minutes later, the team’s beat reporter confirmed that a key defenceman had aggravated a lower-body injury during morning skate and would be a game-time decision. The line had moved before the information was public. That’s line movement in action, and learning to read it is one of the most valuable skills in hockey betting.
A goaltender swap can shift implied probability by 3-5%, and that movement is visible in the line long before the official announcement hits most news feeds. Line movement is the market’s real-time reaction to information — some public, some not. The price you see at any given moment reflects the combined views of every bettor who has acted on that game, weighted by the size of their wagers. Sharp bettors (professionals with strong track records) move lines more than recreational bettors because bookmakers respect their opinions by adjusting prices immediately after their bets land.
Steam Moves, Reverse Movement, and Consensus Shifts
Not all line movement is created equal. Understanding the three main types helps you distinguish between meaningful signals and market noise.
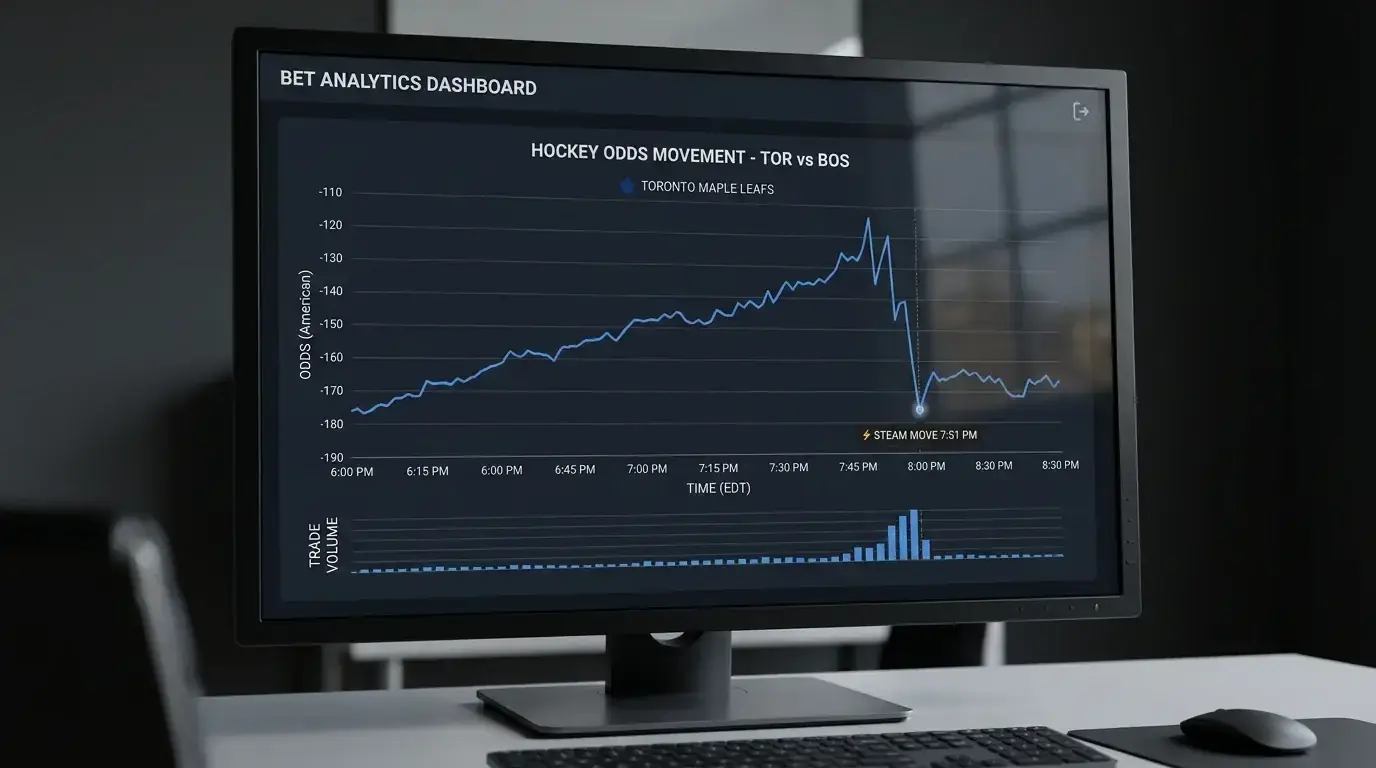
A steam move is a sharp, sudden line shift caused by coordinated action from professional bettors or syndicates. Steam moves in hockey typically occur between two and four hours before game time, often coinciding with goaltender confirmations or late-breaking roster news. The line might jump from -130 to -155 within minutes. If you see a steam move, the question isn’t “should I follow it?” — the question is “has the line moved far enough that the value has already been captured, or is there still room?” In my experience, chasing steam moves in hockey works less than half the time because the post-move price has already absorbed the information that triggered the move.
Reverse line movement is more interesting and more profitable. This occurs when the majority of public bets are on one side, but the line moves in the opposite direction. If 70% of public moneyline bets are on Team A, you’d expect the line to move toward Team A (shorter odds, reflecting public demand). When the line instead moves toward Team B, it means sharp money on Team B has outweighed the volume of public bets on Team A. Reverse line movement is one of the strongest signals available to retail bettors, and I track it for every game I’m considering.
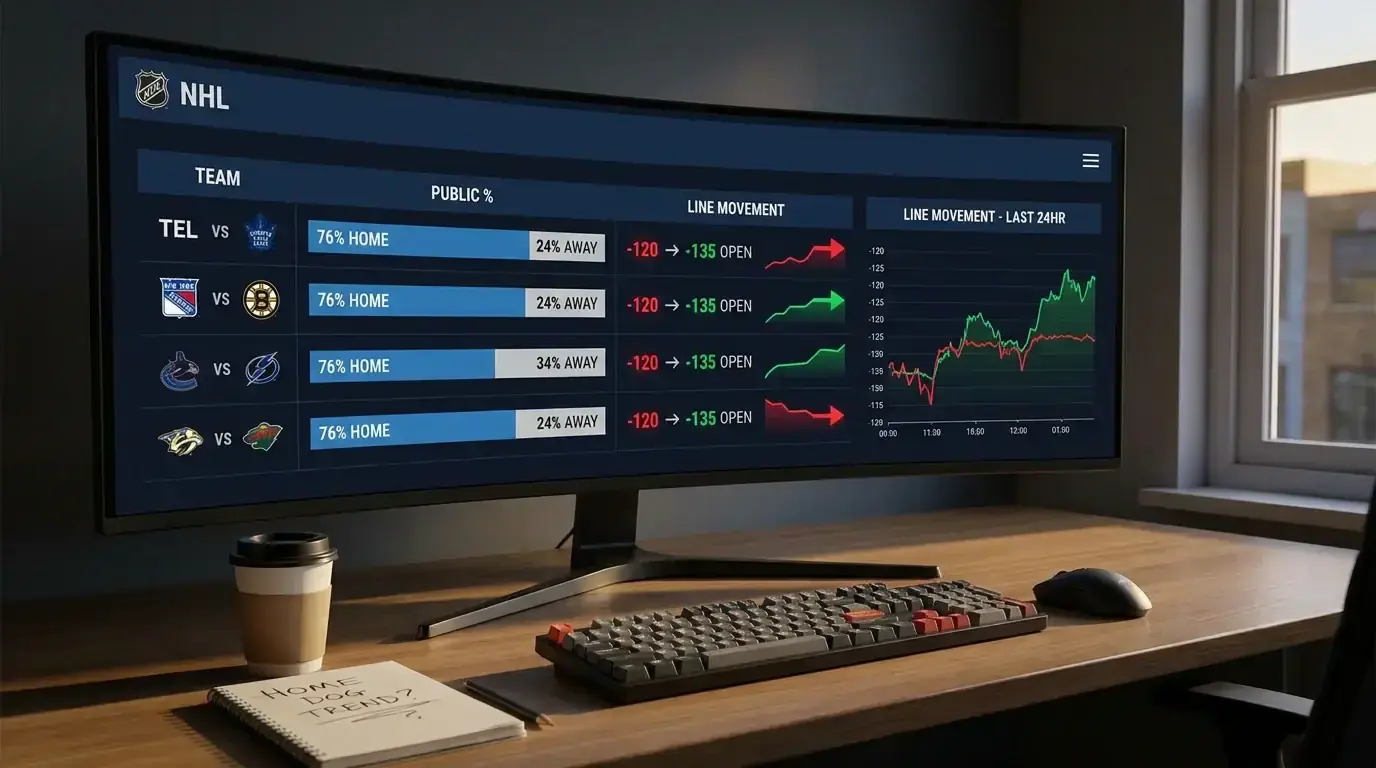
Consensus shifts are gradual, incremental movements that occur over hours rather than minutes. A line that opens at -125 and drifts to -135 over the course of an afternoon isn’t being moved by a single sharp bet — it’s responding to accumulating volume from a broad base of bettors who all lean the same way. Consensus shifts are less actionable than steam moves or reverse movement because they reflect general market sentiment rather than specific information.
Hockey-Specific Triggers for Line Movement
Hockey has unique triggers that don’t exist in other sports. Live-betting handle exceeded 50% of total wagers at DraftKings during 2025, and the growing prevalence of in-play markets means that pre-game line movement increasingly reflects bettors positioning themselves for live betting opportunities rather than traditional pre-game value.

Goaltender confirmations are the single biggest trigger for hockey line movement. When a starting goaltender is confirmed, the line adjusts within minutes. When a surprise backup start is announced, the movement can be dramatic — 10-20 cents on the moneyline in some cases. The speed of this adjustment varies by bookmaker. Some operators adjust instantly; others lag by 15-20 minutes. If you monitor goaltender news and can act quickly, that lag window is where value exists.
Injury reports are the second-most common trigger, but their impact on hockey lines is smaller than in football or basketball. Hockey rosters are deeper than basketball rosters, and the loss of a single forward — even a star — has a more modest effect on win probability than losing a quarterback or a point guard. The exception is when the injury is to a top defenceman on a team with thin defensive depth, which can shift the line by 5-8 cents.

Schedule-related movement is subtler. Lines on the second game of a back-to-back sometimes drift toward the rested opponent during the afternoon as bettors account for fatigue. This drift is more pronounced when the goaltender situation for the back-to-back is uncertain, because the market is pricing both the schedule disadvantage and the goaltender uncertainty simultaneously.
Tools and Sites for Tracking Hockey Line Movement
Several free and paid tools allow you to track line movement for NHL games. The most useful features to look for are: opening and current lines at multiple bookmakers, public betting percentages (what percentage of bets and money are on each side), and historical line movement charts that show how the line has changed since opening.

I use two tools daily. The first shows me opening lines across five or six bookmakers and highlights any line that has moved more than 10 cents since opening. This quick scan takes 30 seconds and immediately flags games with unusual movement. The second shows public betting percentages, which I cross-reference against the direction of line movement to identify reverse line movement opportunities.
One caution: public betting percentages are estimates, not exact figures. The sites that provide them are sampling data from a subset of bookmakers and extrapolating. The direction of the lean is usually accurate (if the site says 72% of bets are on Team A, the true figure is probably above 60%), but the precise number is approximate. Use betting percentages as a directional signal, not a precise measurement.
Line movement analysis is most effective when combined with your own pre-game research. If your analysis points to Team B but the line is moving toward Team A, that’s a signal to re-examine your assumptions. If your analysis and the line movement align, your conviction should increase. The best bets I place each season are the ones where my analysis, the line movement, and the odds value all point in the same direction.
