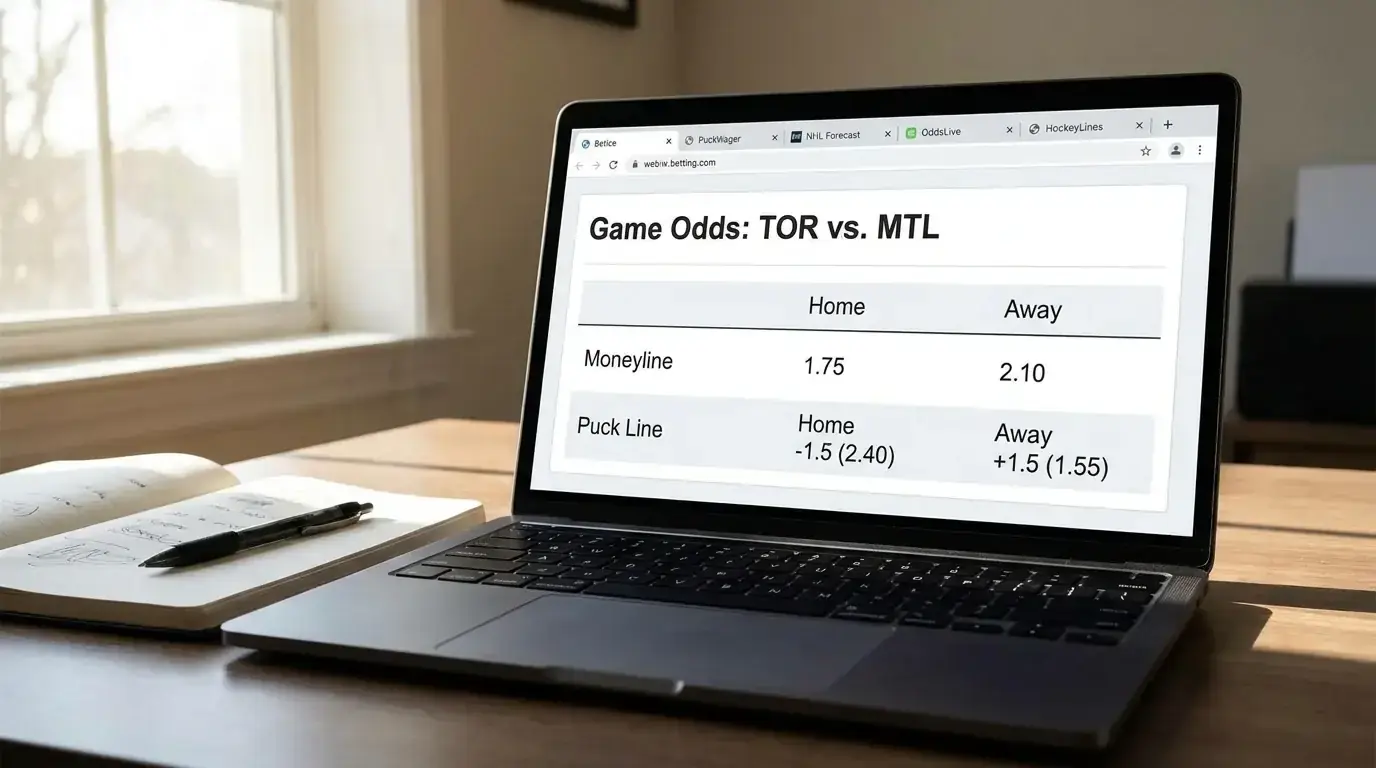


Why Odds Literacy Separates Winning Bettors from the Rest
A mate once showed me a betting slip where he’d backed an NHL team at 6/4 because “the odds looked good.” When I asked him what implied probability that represented, he stared at me like I’d started speaking Finnish. He’d been betting for five years and had never once converted odds to probability. He wasn’t stupid — he was just operating in a market where understanding the price is optional for placing a bet but essential for making money.
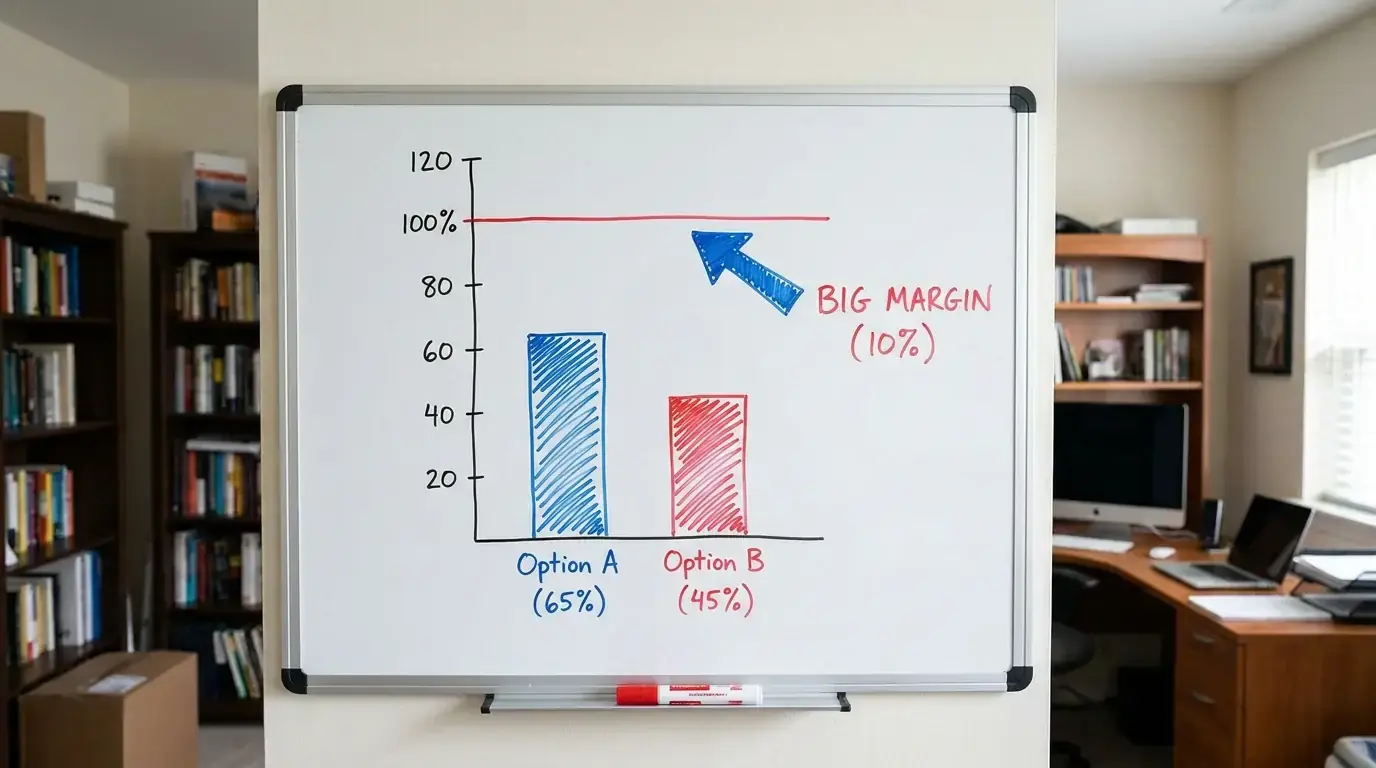
The average sportsbook hold across US operations hit 10.15% in 2025 — meaning for every dollar wagered, the house kept just over ten cents. That figure represents the aggregate margin built into every line, every market, every sport. The bettors who consistently beat that margin are the ones who can look at a price and instantly know three things: what probability the bookmaker is implying, whether that probability accurately reflects the real chance, and how the margin distorts the number they’re seeing.
Hockey odds literacy matters more than in most sports because hockey bettors navigate three different odds formats simultaneously. UK bookmakers default to fractional. European sites use decimal. And every piece of NHL analysis from North American sources — podcasts, Twitter threads, sharp betting communities — uses American odds. If you can’t move fluidly between all three, you’re going to misread value, miss opportunities, or worse, bet on something you’ve misunderstood.
This guide walks through each format with hockey-specific examples, then moves into the mechanics of implied probability, margin, line movement, and value identification. The calculations aren’t complicated, but they are non-negotiable.
Three Odds Formats Used in Hockey Betting
Every odds format expresses the same underlying relationship — the ratio between your stake and your potential return — but each one frames it differently. The format you see depends on where the bookmaker is based, where you’re accessing the site, and sometimes which sport you’re betting on. For hockey, all three formats show up regularly, and fluency in each saves you from mistakes that cost real money.
Fractional Odds: The UK Default
Fractional odds are the format most UK bettors grew up with — 5/1, 7/2, 4/9. The left number tells you the profit on a successful bet, and the right number tells you the stake required. At 5/1, a one-pound bet returns five pounds of profit plus your original stake. At 4/9, you need to stake nine pounds to win four.
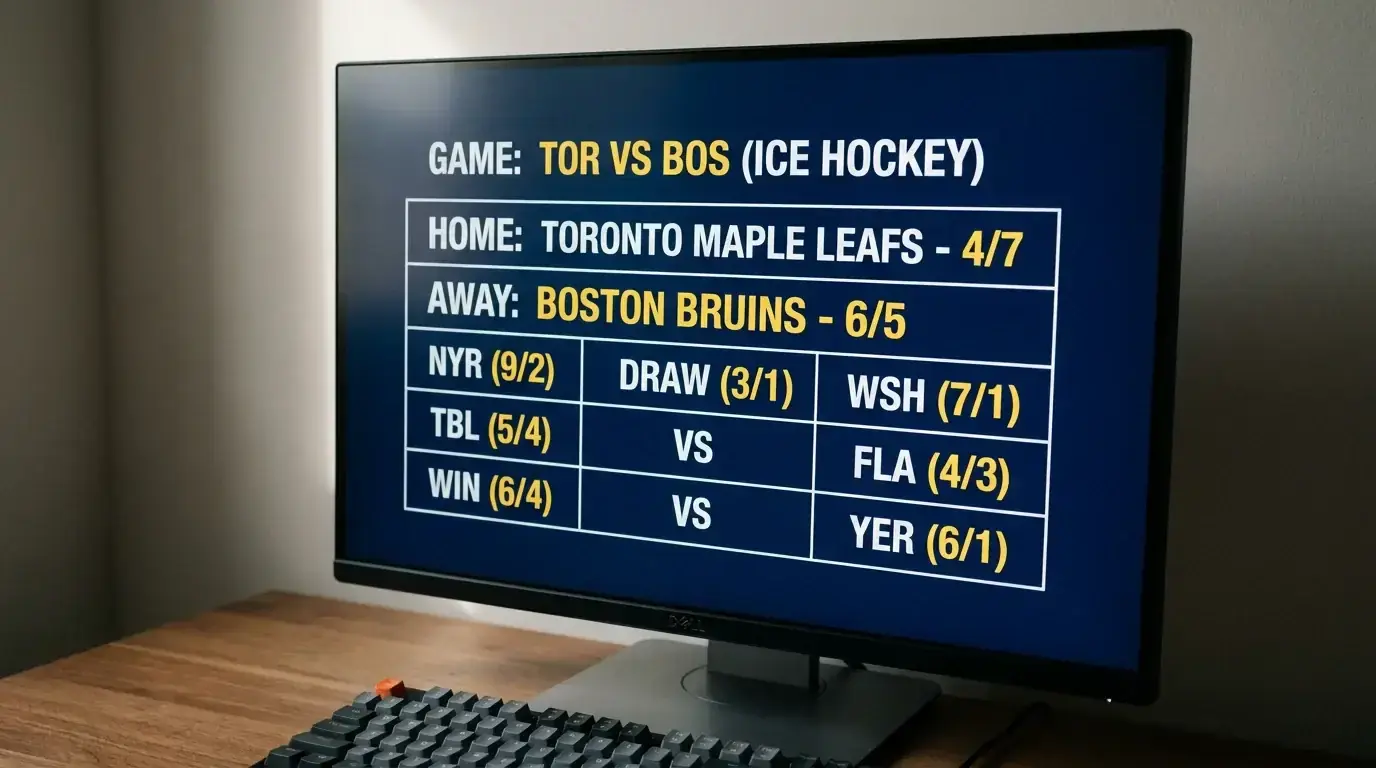
For hockey, fractional odds work perfectly well on moneyline markets. An NHL favourite might be priced at 4/7 while the underdog sits at 6/5. The issue comes with puck line markets, where the prices get more granular. A puck line favourite at -1.5 goals might be listed at 11/10 in fractional, which is clear enough, but the alternative puck lines at -2.5 or +0.5 generate fractions like 13/8 or 2/7 that become harder to evaluate at speed.
The conversion to implied probability is simple division. Take the right number, divide by the sum of both numbers, and multiply by 100. For 4/7: 7 divided by 11 equals 0.636, or 63.6% implied probability. For 6/5: 5 divided by 11 equals 0.455, or 45.5%. Note that those two probabilities sum to 109.1%, not 100%. That extra 9.1% is the bookmaker’s overround — their built-in margin.
I use fractional odds as my default for pre-match NHL bets placed at UK bookmakers, but I switch to decimal for live betting because the rapid price changes are easier to track in decimal form. The choice is personal, but the important thing is being able to convert between formats without reaching for a calculator.
Decimal Odds: The European Standard
Decimal odds express total return rather than just profit. At 2.20, a one-pound bet returns 2.20 total — that’s 1.20 profit plus your original stake. At 1.57, you get 1.57 back for every pound staked. The format is dominant across European bookmakers and increasingly common at UK sites that let you toggle between displays.
The advantage of decimal odds for hockey is clarity when comparing prices. If one operator offers an NHL moneyline at 2.15 and another at 2.25, the comparison is instant — the second operator pays more. Try doing the same comparison in fractional: 23/20 versus 5/4. Both represent similar prices, but the mental arithmetic takes longer and introduces more room for error.
Converting to implied probability is even simpler than with fractional: divide 1 by the decimal odds, then multiply by 100. At 2.20: 1 divided by 2.20 equals 0.4545, or 45.5%. At 1.57: 1 divided by 1.57 equals 0.637, or 63.7%. Again, the sum of both sides will exceed 100% by the margin.
Decimal odds also make it straightforward to compare line shopping results. When you’re checking four operators for the best price on a Tuesday night NHL game, scanning decimal numbers is faster and less error-prone than parsing four different fractional representations. Most serious hockey bettors I know default to decimal for analysis, even if they place their bets in fractional at UK-facing operators.

American Odds: Reading NHL Lines
Every piece of NHL betting content from North America uses American odds, so if you’re reading analysis, listening to hockey betting podcasts, or following sharp bettors on social media, you need to be comfortable with the format. It’s the one that trips up most UK bettors, and it trips them up because it uses two different scales for favourites and underdogs.
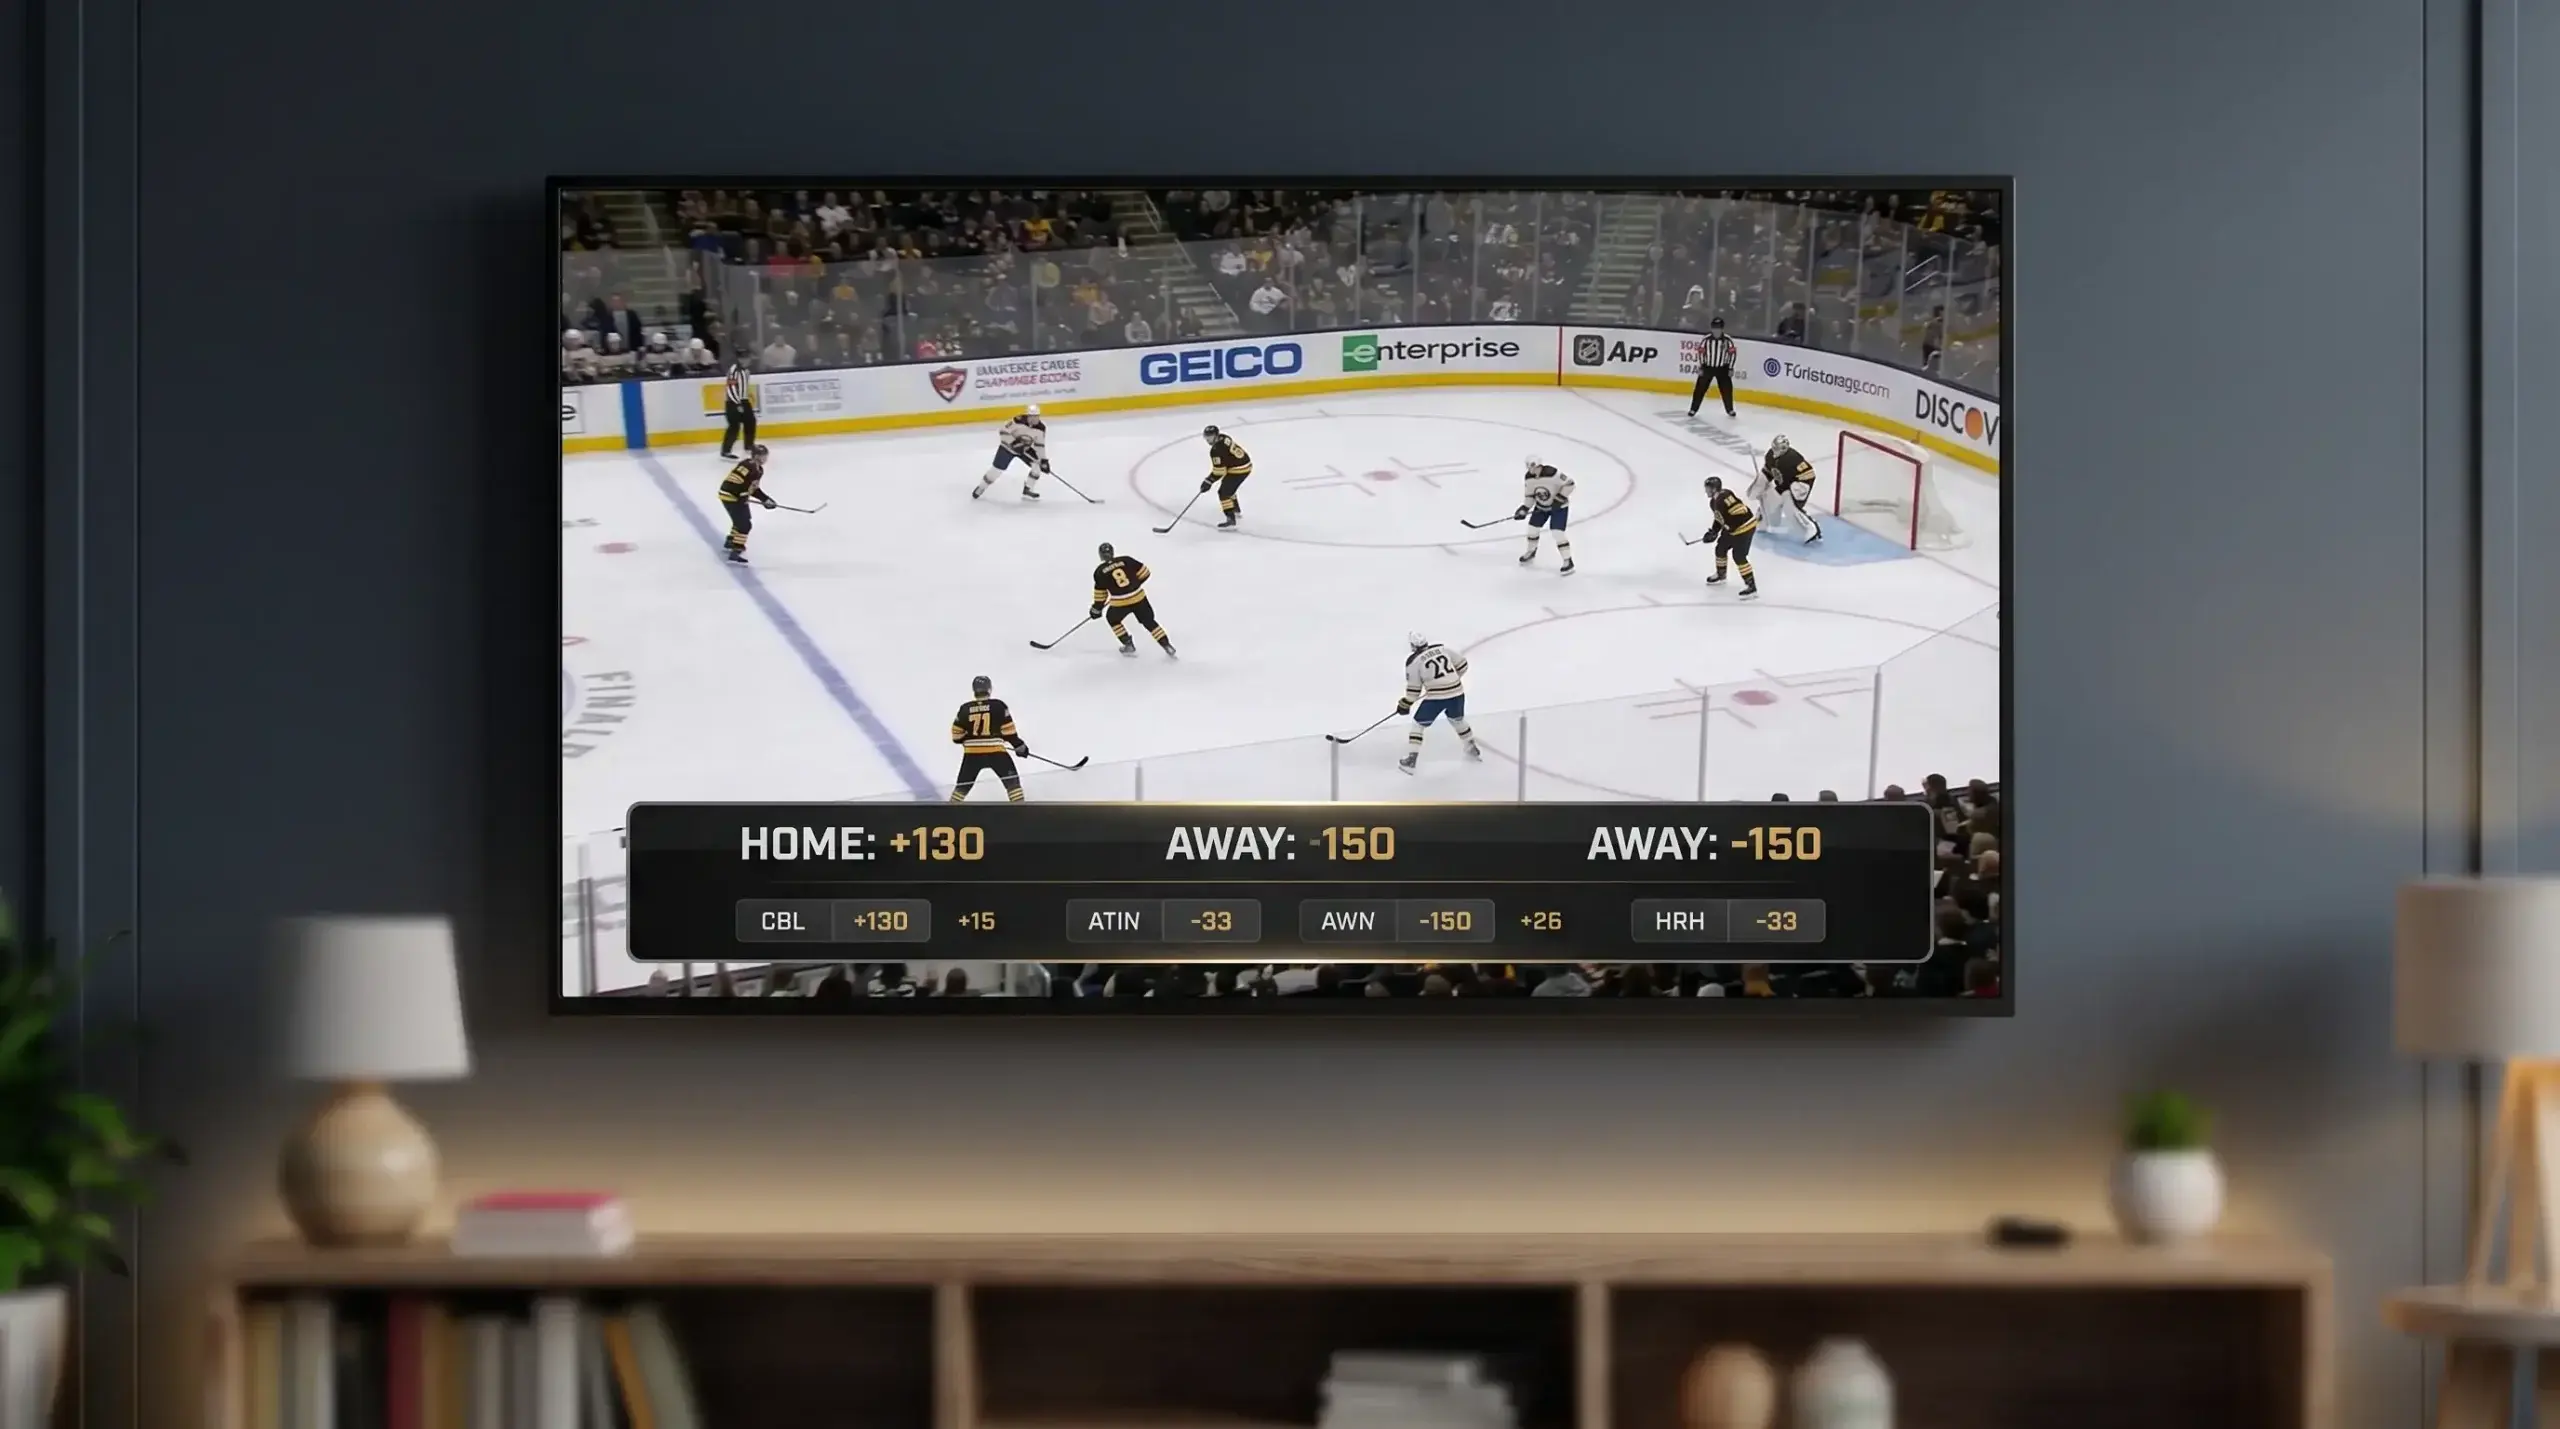
Negative numbers indicate the favourite: -150 means you need to stake 150 to win 100 profit. Positive numbers indicate the underdog: +130 means a 100 stake returns 130 profit. The number always references a baseline of 100, which is why American odds are sometimes called “moneyline odds” in the US context.
Converting from American to decimal is the most common translation UK bettors need. For favourites: divide 100 by the absolute value of the American odds, then add 1. So -150 becomes 100 divided by 150, plus 1, equals 1.667 decimal. For underdogs: divide the American odds by 100, then add 1. So +130 becomes 130 divided by 100, plus 1, equals 2.30 decimal.
The reason American odds dominate NHL discussion is historical — they originated in US horse racing and carried over to sports betting. For hockey specifically, the standard puck line in American odds is expressed as something like “Favourite -1.5 (+155) / Underdog +1.5 (-180),” where the odds attached to each side of the handicap tell you the price for that specific spread. If you see an NHL pick described as “Flames -140” in a North American source, that translates to roughly 1.71 decimal or 5/7 fractional — a moderate favourite.
My recommendation: set your UK bookmaker account to decimal display, but learn to read American fluently. You’ll encounter American odds in every serious NHL analysis source, and the five seconds it takes to convert in your head is faster than missing the context entirely.
Implied Probability and the Bookmaker’s Margin
I was two years into betting hockey before I properly understood the difference between the price I was being offered and the probability it represented. The distinction sounds academic until you realise it’s the entire mechanism by which bookmakers make money — and by which you lose it.
Every set of odds implies a probability. When a bookmaker prices both sides of an NHL moneyline, the implied probabilities will sum to more than 100%. That excess is the overround, or “vig” in American terminology. The average sportsbook hold in the US sat at 10.15% in 2025, and while UK margins vary by operator and market, the principle is identical: you’re always paying a premium above the true probability.
Here’s a worked example. An NHL game is priced with the home team at 1.65 decimal and the away team at 2.40. The implied probability of the home win is 1 divided by 1.65, or 60.6%. The away win probability is 1 divided by 2.40, or 41.7%. Those sum to 102.3%, meaning the margin on this market is 2.3%. That’s a relatively tight line — typical of a high-profile NHL fixture where plenty of sharp money is flowing.
A less popular fixture — say, an EIHL match or an early-season NHL game between two small-market teams — might have a margin of 6 to 8%. The wider the margin, the more the price deviates from true probability, and the harder it is to find value. Bill Miller, President and CEO of the American Gaming Association, has noted that record betting revenues demonstrate the broad appeal of regulated markets. That broad appeal drives volume, and volume drives competition between operators, which generally compresses margins on popular events.
To strip the margin from a line and estimate the “true” probability, you can normalise each side’s implied probability so they sum to 100%. In the example above: 60.6% divided by 102.3% gives 59.2% true probability for the home team, and 41.7% divided by 102.3% gives 40.8% for the away team. If your own assessment says the home team has a 65% chance of winning, and the bookmaker’s “true” price implies only 59.2%, you have a potential value bet. The gap between your number and their number is where long-term profit lives.
One more thing about margins: they aren’t uniform across markets within the same game. A bookmaker might price the moneyline with a 4% margin but set the puck line at 6% and an exotic prop at 10%. The tighter the margin, the more confident the bookmaker is in their pricing — and generally, the harder it is for you to find an edge. Knowing where margins are widest in a given game tells you where the bookmaker is least confident, and that’s precisely where informed analysis can generate the most value.
What Makes Hockey Odds Move
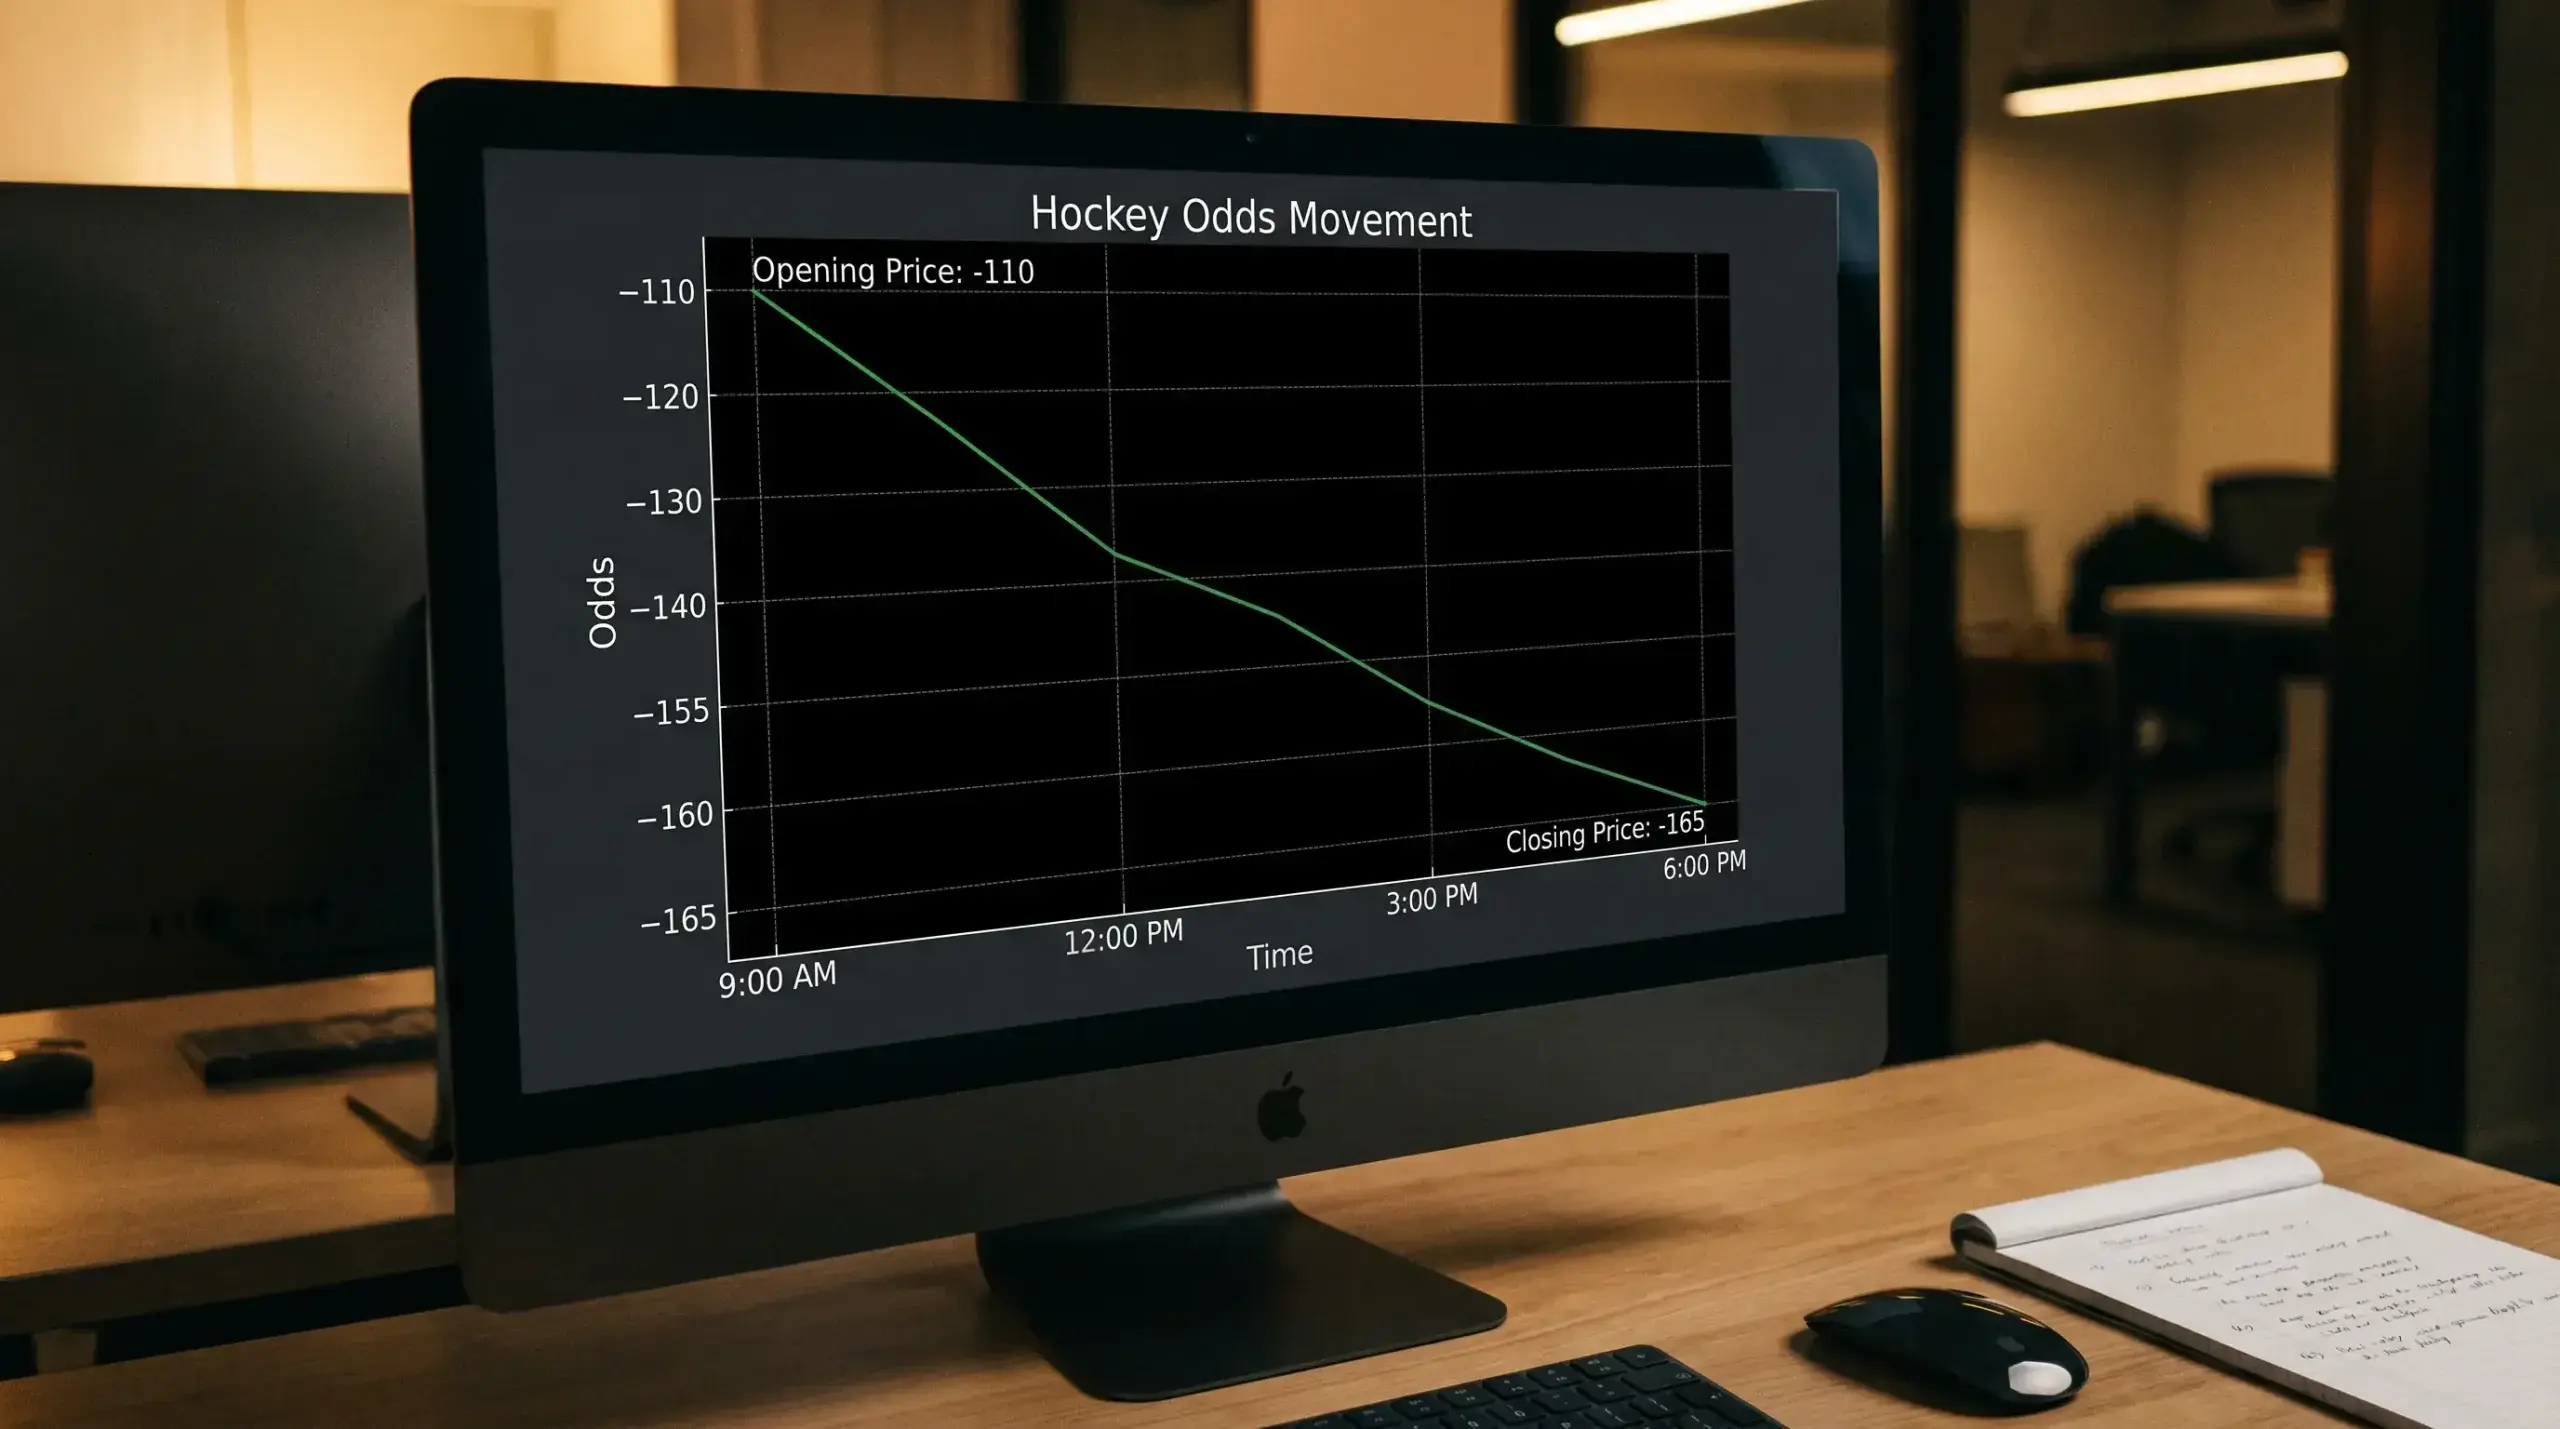
Hockey odds don’t stand still. From the moment a line opens to puck drop, prices shift in response to information and money. Understanding why odds move — and recognising which movements carry signal versus noise — is the second layer of odds literacy that separates informed bettors from everyone else.
The single biggest trigger for NHL line movement is the starting goaltender announcement. A shift of 3 to 5 percentage points in implied probability on a single confirmation is standard. If a team’s backup goaltender is named as the starter, the line moves against that team immediately. This isn’t speculation — it’s the market repricing based on the most significant pre-game variable in the sport. The movement happens within minutes of the confirmation hitting the wire, which means UK bettors who aren’t watching for goaltender news between 3:30 and 5:00 PM GMT are betting on stale information.
Injury news produces a second category of movement. The loss of a top-line forward or a number-one defenceman can shift a line by one to three ticks, depending on the player’s impact. These movements tend to be slower than goaltender-driven shifts because injury severity is often ambiguous — “day-to-day” designations don’t tell you whether the player will dress.
The third driver is money flow. When a large volume of bets lands on one side of a market, the bookmaker adjusts the line to balance their exposure. In the NHL, this happens most visibly on marquee matchups where recreational bettors pile onto the favourite. The live betting share at major operators now exceeds 50% of total handle, meaning odds movement doesn’t stop at puck drop — it accelerates. Every goal, every penalty, every momentum swing triggers a repricing in the in-play market.
What separates useful movement from noise is the source. Sharp money — bets from accounts the bookmaker has identified as consistently profitable — moves lines first and fast. Recreational money follows later and moves lines more slowly. If you see a line move sharply in the morning without any corresponding news, it’s often a signal that sharp bettors have identified a discrepancy. Following the direction of that movement, rather than fading it, is usually the better play.
How to Identify Value in Hockey Lines
Finding value in hockey lines starts with a question that most bettors never explicitly answer: what do I think the true probability of this outcome is? Not a vague sense of “this team should win” — an actual number. If you can’t put a probability on your assessment, you can’t measure it against the bookmaker’s implied probability, and without that comparison, you’re guessing.
I build my probability estimates from a handful of inputs. Historical scoring rates for both teams over their last twenty games give me a baseline. The starting goaltender’s save percentage adjusts that baseline up or down. Schedule context — rest advantage, travel, back-to-back status — adds a further adjustment. And situational factors like home ice, divisional rivalry intensity, and playoff implications round out the picture. The final number is imprecise, but it doesn’t need to be perfect. It needs to be consistently better than the bookmaker’s number by enough to overcome the margin.
NHL totals usually open around 6 or 6.5, reflecting a league-wide average of approximately six goals per game. That baseline creates a reference point for totals value. If two teams with above-average offences and below-average goaltending meet, and the total is set at 6, the market might be underpricing the over. If both teams are defensively strong and the total is still 6.5, the under might represent value. The key is anchoring your assessment to the actual scoring profiles of the teams involved, not to the generic league average.
Value identification is a process, not an event. You won’t find value on every game, and you shouldn’t be looking for it. Most nights, the lines are efficient enough that no edge exists for a bettor working with publicly available data. The discipline is in recognising which games offer genuine discrepancies and restricting your bets to those situations, rather than forcing action on a full slate just because there are twelve games to choose from.
One practical technique I use: I set my estimated probabilities for each game on a Tuesday night slate, then check them against the market thirty minutes before puck drop. If any of my numbers diverge from the implied probability by more than five percentage points after the margin is stripped, I investigate further. If the divergence holds up under scrutiny — it isn’t explained by late news I missed, and it’s consistent with the underlying data — I bet. If the divergence is less than five points, I pass. That threshold is arbitrary, but it forces discipline and prevents me from betting on marginal edges that don’t survive the margin.
Comparing Odds Across UK Bookmakers
When you’re comparing the same NHL game across multiple UK bookmakers, the odds format each operator defaults to can make the comparison harder than it needs to be. One site shows 4/7 fractional, another shows 1.57 decimal, and an NHL analytics source references -175 American. All three might represent essentially the same price, or one might be meaningfully better — and the only way to tell quickly is to normalise everything to one format.
Decimal is the easiest format for direct comparison. The difference between 1.85 and 1.90 is instantly visible; the equivalent fractional comparison between 17/20 and 9/10 requires more mental processing. When I’m scanning prices across operators, I convert everything to decimal before evaluating. The extra step takes seconds but eliminates the comparison errors that fractional oddities can produce.
The price variation on NHL moneylines across UK bookmakers is typically small — a tick or two in decimal terms. But on puck lines and totals, the variation widens because fewer operators price those markets with the same confidence. I’ve seen puck line prices vary by 0.15 in decimal between operators on the same game, which on a fifty-pound stake represents a meaningful difference in expected value.
One pattern I’ve noticed: operators that built their reputation on football tend to price NHL moneylines competitively but set wider margins on secondary hockey markets. Operators with a broader international sports portfolio often price puck lines and totals more tightly because they have access to better models for those markets. Neither type consistently offers the best price across all markets, which is why checking multiple sources matters — a topic I explore in more detail in the hockey betting strategy framework.