

What Expected Goals Measures That the Scoreboard Doesn’t
In March 2025, I watched a team outshoot their opponent 38-19 and lose 1-3. The scoreboard said one team dominated. The xG model said the other team took three high-danger chances and buried all of them, while the “dominant” team peppered the goaltender with low-quality shots from the perimeter. That game converted me from an xG sceptic into someone who checks it before every bet.
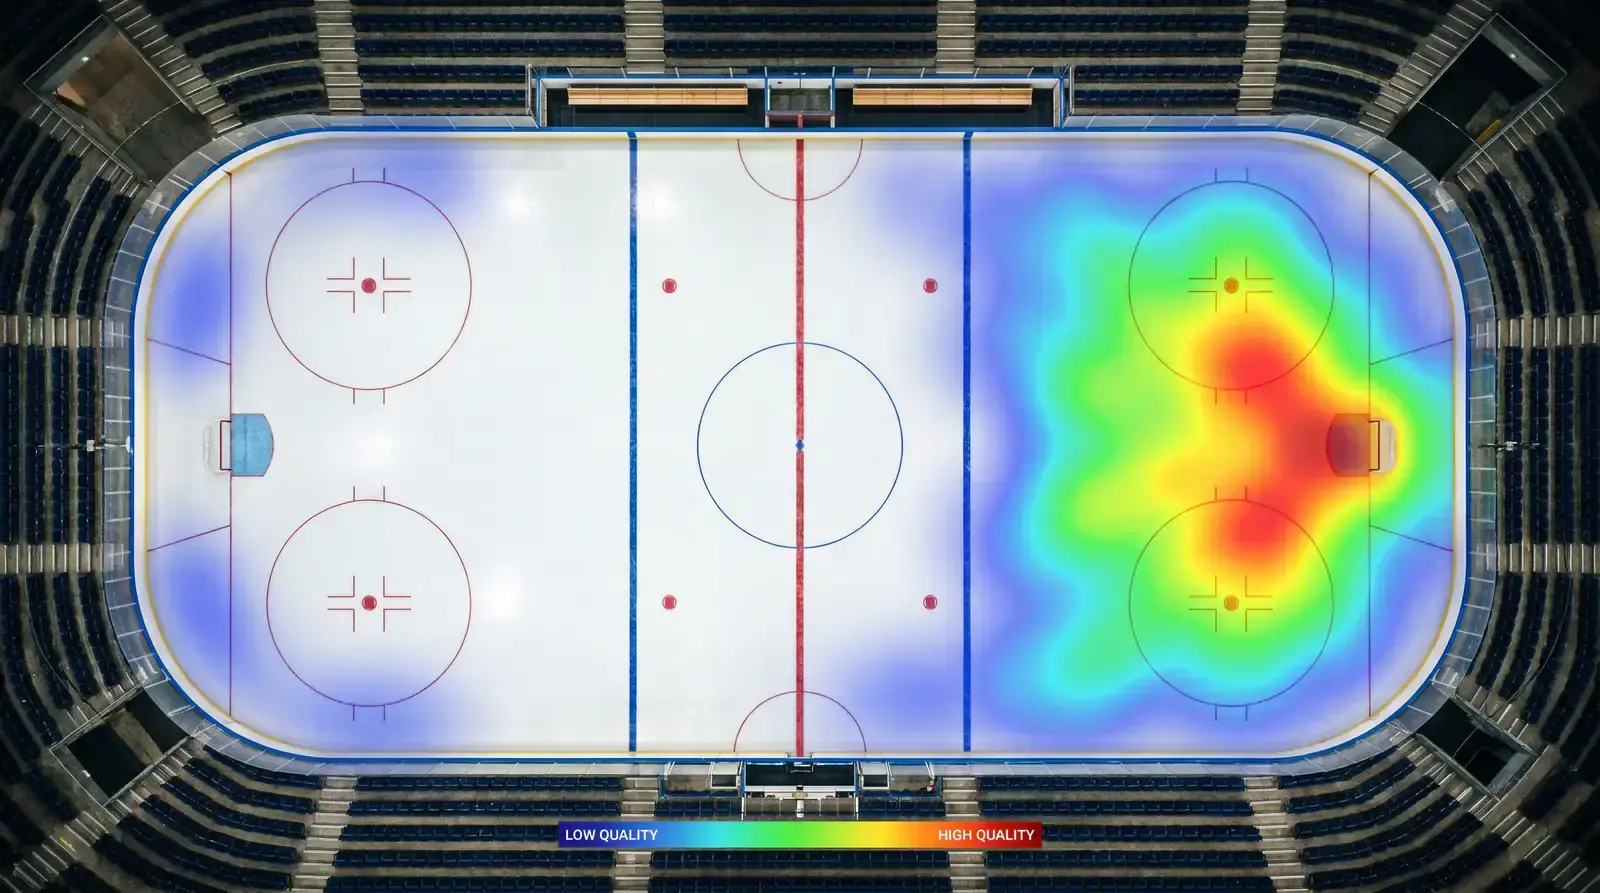
Expected goals — xG — assigns a probability to every unblocked shot based on factors like distance from the net, shot angle, whether the shot came off a rush or a set play, and the type of shot (wrist, slap, backhand). A shot from the slot with a clear lane might carry an xG of 0.25, meaning it would score 25% of the time across a large sample. A perimeter wrist shot from the blue line might carry an xG of 0.03. Summing the xG of every shot in a game gives you a team’s expected goals — a measure of how many goals they “deserved” based on the quality and quantity of their chances.
NHL average viewership hit 546,000 per game in the 2025-26 season, a 14-year high, and the growing audience has fuelled broader interest in analytical approaches to the sport. For bettors, xG’s value is simple: it strips away the randomness of goaltender performance and finishing luck, revealing the underlying process that generates goals. A team that creates 3.2 xG per game but only scores 2.4 goals is being let down by poor finishing or excellent opposing goaltending — and both of those factors tend to regress toward the mean over time.
How the xG Model Works in Hockey
Every major hockey analytics site runs its own xG model, and the details differ. Some weight pre-shot movement (passes before the shot), others don’t. Some account for shooter identity — an elite sniper’s shot from the slot is worth more than a fourth-liner’s — while others treat all shooters equally. Despite these differences, the models correlate highly with each other, typically agreeing on which teams generate the best and worst chances.

The core inputs are consistent across models. Shot location is the strongest predictor of goal probability. A shot from within the “home plate” area — roughly the zone between the faceoff dots and the crease — carries an xG between 0.10 and 0.40 depending on angle and traffic. Shots from outside this zone carry an xG below 0.05. Rush chances (odd-man situations like 2-on-1 or 3-on-2) receive an xG boost because the goaltender has less time to set up. Rebounds also receive elevated xG values because the goaltender is typically out of position.
What xG doesn’t capture is equally important. It doesn’t account for goaltender quality (that’s a separate metric — goals saved above expected, or GSAx). It doesn’t capture the psychological pressure of a playoff game. And it doesn’t adjust for game state — a team trailing by three goals in the third period generates shots at a different rate and quality than a team protecting a lead. When using xG for betting, these limitations matter and should temper how heavily you lean on any single number.
Using xG to Assess Over/Under Lines
Totals typically open near 6 or 6.5 for NHL games, and xG gives you a framework for determining whether the line is set correctly. If Team A generates 3.4 xG per game and Team B generates 2.9 xG per game, the combined expected output is 6.3 — which suggests a total of 6 is fair and 6.5 leans slightly toward the under.

But the calculation isn’t that simple. xG measures chance creation, not goal scoring. Actual goals depend on shooting talent (some teams finish above their xG consistently because of elite shooters) and goaltending (some teams concede below their xG against because of elite netminders). For totals betting, I adjust the raw xG by looking at each team’s shooting percentage relative to league average and each goaltender’s GSAx rating. A matchup between two teams with high xG but also elite goaltending might play under despite the offensive numbers suggesting otherwise.
Where xG shines most brightly for totals is identifying mispriced games where public perception diverges from underlying performance. A team on a four-game losing streak might see its totals line drop because the public perceives them as cold. But if the team’s xG during that streak was strong — meaning they were creating quality chances and simply not finishing — the regression opportunity is significant. Their goals will come, and when they do, the over becomes the play.

I’ve found xG most useful for the first three to four weeks of a new NHL season, when bookmakers are still calibrating their models and early-season results are heavily influenced by small-sample randomness. During this period, xG provides a more stable signal than actual results, and the market is slow to incorporate it.
Limitations and Misuses of xG in Betting
The biggest mistake I see bettors make with xG is treating it as a prediction rather than a description. xG tells you what happened — how many goals a team “should have” scored based on their shot quality. It doesn’t tell you what will happen in tonight’s game. Extrapolating xG forward requires assumptions about whether a team will continue to create chances at the same rate, against a specific opponent, with specific goaltenders, in a specific game context.

Another common error is ignoring sample size. A team’s xG from ten games is far less reliable than their xG from fifty. I don’t place serious weight on xG data until a team has played at least 20 games in a season. Before that threshold, individual games with unusual shot profiles (a single game with eight high-danger chances) can skew the average dramatically.
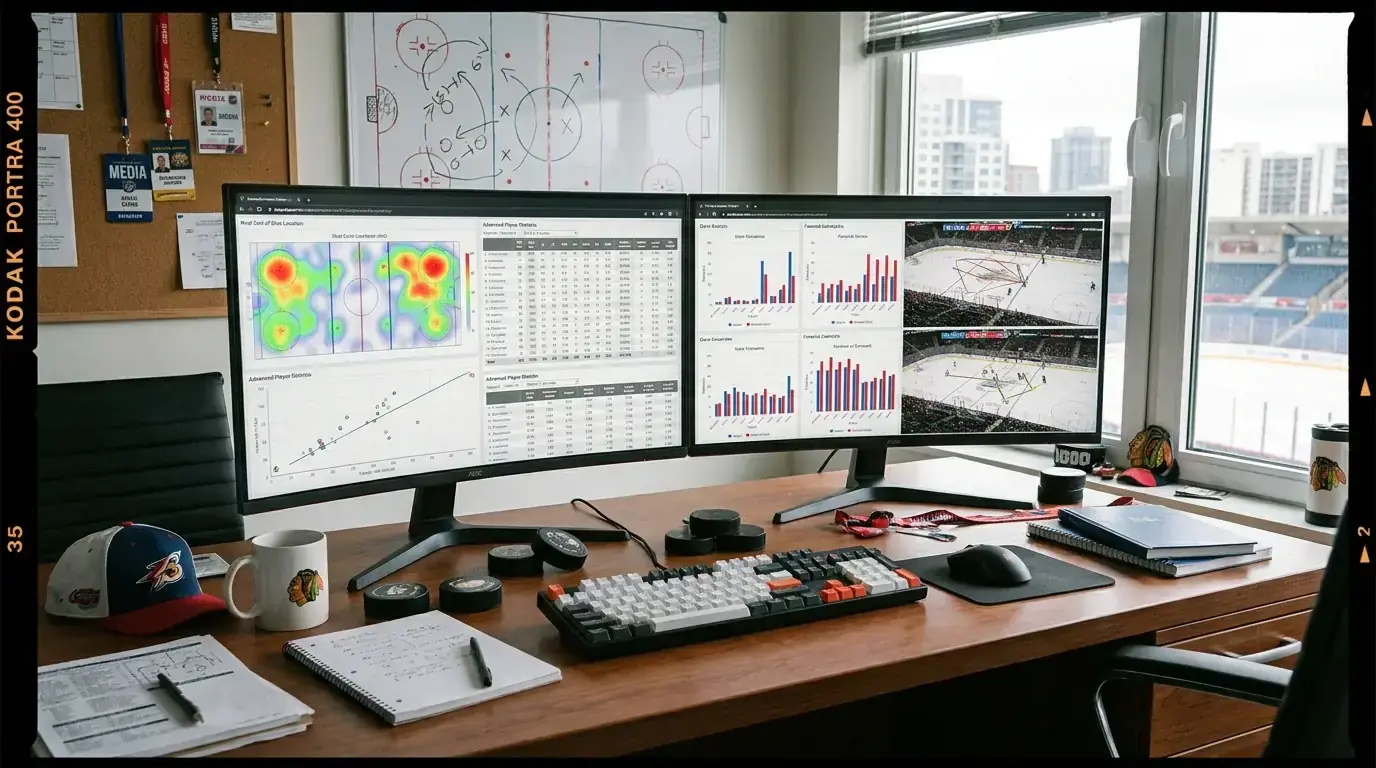
Score effects complicate xG as well. Teams trailing in the third period generate more shots and higher xG because the defending team collapses and protects a lead rather than pressing forward. If you use full-game xG without adjusting for score effects, you’ll overrate teams that frequently trail — they look better offensively than they actually are in competitive situations.
Finally, xG is one tool among many. Combining it with possession metrics like Corsi and Fenwick gives you a more complete picture than using any single metric in isolation. The best hockey bettors I know use xG as a filter, not a decision-maker. It narrows the field of potential bets; the final decision comes from integrating xG with goaltender matchups, schedule context, and market price.
